National Grid 2006 Annual Report Download - page 54
Download and view the complete annual report
Please find page 54 of the 2006 National Grid annual report below. You can navigate through the pages in the report by either clicking on the pages listed below, or by using the keyword search tool below to find specific information within the annual report.-
 1
1 -
2
-
3
-
4
-
5
-
6
-
7
-
8
-
9
-
10
-
11
-
12
-
13
-
14
-
15
-
16
-
17
-
18
-
19
-
20
-
21
-
22
-
23
-
24
-
25
-
26
-
27
-
28
-
29
-
30
-
31
-
32
-
33
-
34
-
35
-
36
-
37
-
38
-
39
-
40
-
41
-
42
-
43
-
 44
44 -
 45
45 -
 46
46 -
 47
47 -
 48
48 -
 49
49 -
 50
50 -
 51
51 -
 52
52 -
 53
53 -
 54
54 -
 55
55 -
 56
56 -
 57
57 -
 58
58 -
 59
59 -
 60
60 -
 61
61 -
 62
62 -
 63
63 -
 64
64 -
65
-
66
-
67
 |
 |

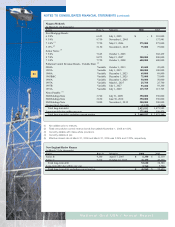
NOTES TO CONSOLIDATED FINANCIAL STATEMENTS (continued)
Assumptions Used for Benefits Accounting
The following weighted average assumptions were used to determine the pension and PBOP
benefit obligations and net periodic benefit costs for the fiscal years ending March 31.
* In fiscal year 2006, the healthcare cost trend assumption was updated to include rates for the
pre 65 and post 65 groups.
The expected contributions to the Company’s pension and PBOP plans during fiscal year 2007
are expected to be $164 million and $134 million, respectively.
54
National Grid USA / Annual Report
2006 2005 2006 2005
Benefit obligations
Discount rate 6.00% 5.75% 6.00% 5.75%
Rate of compensation increase -
New England 4.30% 4.30% n/a n/a
Rate of compensation increase -
New York 3.90% 3.90% n/a n/a
Expected long-term rate of return 8.00% 8.25% 7.80% 7.93%
Health care cost trend rate
Initial n/a n/a n/a 10.00%
Pre 65* n/a n/a 10.00% n/a
Post 65* n/a n/a 11.00% n/a
Ultimate n/a n/a 5.00% 5.00%
Year ultimate rate is reached n/a n/a n/a 2010
Pre 65* n/a n/a 2011 n/a
Post 65* n/a n/a 2012 n/a
Pension Benefits PBOP
2006 2005 2004 2006 2005 2004
Net periodic benefit cost
Discount rate 5.75% 5.75% 6.25% 5.75% 5.75% 6.25%
Rate of compensation increase -
New England 4.30% 4.30% 4.63% n/a n/a n/a
Rate of compensation increase -
New York 3.90% 3.25% 3.25% n/a n/a n/a
Expected long-term rate of return 8.25% 8.50% 8.75% 8.05% 8.13% 8.00%
Health care cost trend rate
Initial n/a n/a n/a 10.00% 10.00% 10.00%
Ultimate n/a n/a n/a 5.00% 5.00% 5.00%
Year ultimate rate reached n/a n/a n/a 2010 2009 2008
Pension Benefits PBOP