National Grid 2006 Annual Report Download - page 53
Download and view the complete annual report
Please find page 53 of the 2006 National Grid annual report below. You can navigate through the pages in the report by either clicking on the pages listed below, or by using the keyword search tool below to find specific information within the annual report.-
 1
1 -
2
-
3
-
4
-
5
-
6
-
7
-
8
-
9
-
10
-
11
-
12
-
13
-
14
-
15
-
16
-
17
-
18
-
19
-
20
-
21
-
22
-
23
-
24
-
25
-
26
-
27
-
28
-
29
-
30
-
31
-
32
-
33
-
34
-
35
-
36
-
37
-
38
-
39
-
40
-
41
-
42
-
 43
43 -
 44
44 -
 45
45 -
 46
46 -
 47
47 -
 48
48 -
 49
49 -
 50
50 -
 51
51 -
 52
52 -
 53
53 -
 54
54 -
 55
55 -
 56
56 -
 57
57 -
 58
58 -
 59
59 -
 60
60 -
 61
61 -
 62
62 -
 63
63 -
64
-
65
-
66
-
67
 |
 |

NOTES TO CONSOLIDATED FINANCIAL STATEMENTS (continued)
Funding Policy
In New England, absent unusual circumstances, the Company’s funding policy is to contribute to
the pension plans each year the maximum tax deductible amounts for that year (funding for VEBA
plans may be based on either expense or the maximum tax deductible amounts for that year
depending on the tax status of the plan). In New York, the funding policy is determined largely by
the Company’s settlement agreements with the PSC and the amounts recovered in rates.
However, the contribution for any year will not be less than the minimum contribution required by
federal law or greater than the maximum tax-deductible amount.
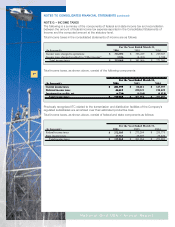
Plan Assets
The target asset allocations for the benefit plans at March 31 are:
The percentage of the fair value of total plan assets at March 31 is:
The Company manages benefit plan investments to minimize the long-term cost of operating
the Plans, with a reasonable level of risk. Risk tolerance is determined as a result of a periodic
asset/liability study which analyzes the Plans’ liabilities and funded status and results in the deter-
mination of the allocation of assets across equity and fixed income. Equity investments are broadly
diversified across U.S. and non-U.S. stocks, as well as across growth, value, and small and large
capitalization stocks. Likewise, the fixed income portfolio is broadly diversified across the various
fixed income market segments. Small investments are also held in private equity with the objective
of enhancing long-term returns while improving portfolio diversification. For the PBOP plan, since
the earnings on a portion of the assets are taxable, those investments are managed to maximize
after tax returns consistent with the broad asset class parameters established by the asset alloca-
tion study. Investment risk and return is reviewed by the investment committee on a quarterly
basis.
The estimated rate of return for various passive asset classes is based both on analysis of
historical rates of return and forward looking analysis of risk premiums and yields. Current
market conditions, such as inflation and interest rates, are evaluated in connection with the
setting of the long-term assumption. A small premium is added for active management of both
equity and fixed income. The rates of return for each asset class are then weighted in accordance
with the plans’ target asset allocation, and the resulting long-term return on asset rate is then
applied to the market-related value of assets.
53
National Grid USA / Annual Report
2006 2005 2006 2005 2006 2005
U.S. equities 42% 43% 33% 37% 51% 50%
Global equities (including U.S.) 6% 7% 0% 0% 0% 0%
Non-U.S. equities 12% 12% 17% 2% 23% 16%
Fixed income 35% 35% 50% 61% 26% 34%
Private equity and property 5% 3% 0% 0% 0% 0%
100% 100% 100% 100% 100% 100%
Pension Benefits
Non-Union PBOP
Union PBOP
2006 2005 2006 2005 2006 2005
U.S. equities 45% 45% 33% 40% 51% 55%
Global equities (including U.S.) 8% 8% 0% 0% 24% 18%
Non-U.S. equities 13% 12% 18% 3% 0% 0%
Fixed income 32% 34% 49% 57% 25% 27%
Private equity and property 2% 1% 0% 0% 0% 0%
100% 100% 100% 100% 100% 100%
Pension Benefits Non-Union PBOP Union PBOP