National Grid 2006 Annual Report Download - page 15
Download and view the complete annual report
Please find page 15 of the 2006 National Grid annual report below. You can navigate through the pages in the report by either clicking on the pages listed below, or by using the keyword search tool below to find specific information within the annual report.-
 1
1 -
2
-
3
-
4
-
 5
5 -
 6
6 -
 7
7 -
 8
8 -
 9
9 -
 10
10 -
 11
11 -
 12
12 -
 13
13 -
 14
14 -
 15
15 -
 16
16 -
 17
17 -
 18
18 -
 19
19 -
 20
20 -
 21
21 -
 22
22 -
 23
23 -
 24
24 -
 25
25 -
26
-
27
-
28
-
29
-
30
-
31
-
32
-
33
-
34
-
35
-
36
-
37
-
38
-
39
-
40
-
41
-
42
-
43
-
44
-
45
-
46
-
47
-
48
-
49
-
50
-
51
-
52
-
53
-
54
-
55
-
56
-
57
-
58
-
59
-
60
-
61
-
62
-
63
-
64
-
65
-
66
-
67
 |
 |

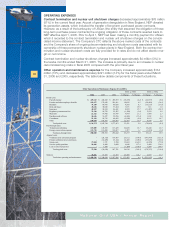
Economic impacts
During fiscal year 2006, the Company’s service territories experienced one of the hottest summers
on record. This swelled electricity deliveries by nearly 1.9% relative to the prior fiscal year. The
summer also brought soaring energy prices after two hurricanes significantly affected operations of
the U.S. oil and gas infrastructure in the Gulf of Mexico. The high energy prices, particularly during
the second half of fiscal year 2006, caused a moderation of the New York and New England
regional economies and a slowing of demand growth for electricity and natural gas.
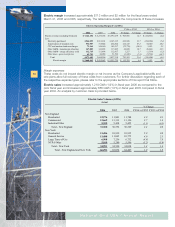
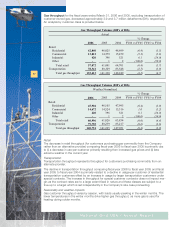
Electric revenues increased approximately $906 million (14.5%) and decreased approximately
$155 million (2.4%) for the fiscal years ended March 31, 2006 and 2005, respectively. The table
below details components of these fluctuations.
■Total retail sales for fiscal year 2006 increased $625 million compared to the prior fiscal year
primarily due to an increase in purchased power costs. The Company, through various rate
mechanisms, passes on to customers changes in its cost of purchased power.
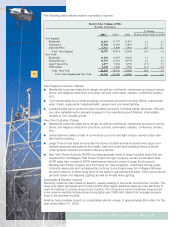
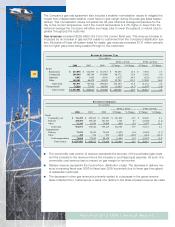
■Sales for resale are revenues generated from selling electricity to other public utilities or munic-
ipal utilities. The $8 million increase in fiscal year 2006 compared to fiscal year 2005 is primari-
ly due to NEP’s resumption of the USGen contracts. The $97 million decrease in fiscal year
2005 compared to fiscal year 2004 is primarily due to a decrease in Niagara Mohawk sales to
the New York Independent System Operator (NYISO) of approximately $89 million. In New
York, all electricity purchased under certain purchased power contracts is sold to the NYISO.
The decrease in sales to the NYISO for the fiscal year ended March 31, 2005 was due to the
expiration of some of these contracts.
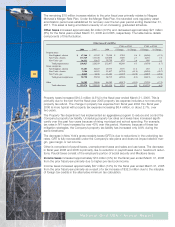
■Refund provisions primarily relate to the New England distribution companies’ (Massachusetts
Electric, Narragansett Electric, Granite State Electric and Nantucket Electric) deferral mecha-
nisms for the over and under collection of electricity procurement costs. Electricity is procured
for customers who have not chosen an alternative energy supplier. These purchased electricity
costs fluctuate from month to month, but the rate charged to customers changes less often.
This results in either a temporary over or under collection of costs. The refund provision
reflects this over or under recovery with an offset to a regulatory asset or liability for recovery
or refund in the following year. Periodically, the customer rates for electricity procurement
(shown as a “generation” charge on the customers’ bills) are adjusted to reflect actual or fore-
casted purchased electricity costs along with an increase or reduction for any over or under
collection of prior period costs. In fiscal years 2006, 2005, and 2004 there was an under col-
lection of costs. This portion of revenue has no impact on electric margin or net income due
to equal offsets in purchased electricity (cost of power) and retail sales revenue.
15
National Grid USA / Annual Report
Electric Revenue ($'s in 000's)
Actual
2006 2005 2004 $ Change % Change $ Change % Change
Retail sales and deliveries
Residential 3,095,154$ 2,708,421$ 2,820,271$ 386,733$ 14.3 (111,850)$ (4.0)
Commercial 2,374,474 2,203,203 2,072,745 171,271 7.8 130,458 6.3
Industrial 796,775 726,295 743,761 70,480 9.7 (17,466) (2.3)
Street lighting 74,170 77,423 71,869 (3,253) (4.2) 5,554 7.7
Total retail sales 6,340,573 5,715,342 5,708,646 625,231 10.9 6,696 0.1
Sales for resale 134,316 126,706 223,789 7,610 6.0 (97,083) (43.4)
Refund provisions 34,802 5,590 97,190 29,212 522.6 (91,600) (94.2)
Other revenues 632,463 388,550 361,414 243,913 62.8 27,136 7.5
Total electric revenue (excluding Gridcom) 7,142,154$ 6,236,188$ 6,391,039$ 905,966$ 14.5 (154,851)$ (2.4)
FY05 vs FY04FY06 vs FY05