National Grid 2006 Annual Report Download - page 35
Download and view the complete annual report
Please find page 35 of the 2006 National Grid annual report below. You can navigate through the pages in the report by either clicking on the pages listed below, or by using the keyword search tool below to find specific information within the annual report.-
 1
1 -
2
-
3
-
4
-
5
-
6
-
7
-
8
-
9
-
10
-
11
-
12
-
13
-
14
-
15
-
16
-
17
-
18
-
19
-
20
-
21
-
22
-
23
-
24
-
 25
25 -
 26
26 -
 27
27 -
 28
28 -
 29
29 -
 30
30 -
 31
31 -
 32
32 -
 33
33 -
 34
34 -
 35
35 -
 36
36 -
 37
37 -
 38
38 -
 39
39 -
 40
40 -
 41
41 -
 42
42 -
 43
43 -
 44
44 -
 45
45 -
46
-
47
-
48
-
49
-
50
-
51
-
52
-
53
-
54
-
55
-
56
-
57
-
58
-
59
-
60
-
61
-
62
-
63
-
64
-
65
-
66
-
67
 |
 |
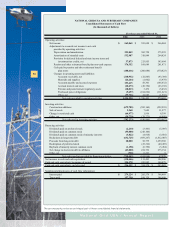
The accompanying notes are an integral part of these consolidated financial statements.
35
National Grid USA / Annual Report
2006 2005 2004
Operating activities:
Net income 562,065$ 553,698$ 266,084$
Adjustments to reconcile net income to net cash
provided by operating activities:
Depreciation and amortization 393,849 382,758 375,995
Amortization of stranded costs 532,987 318,844 264,824
Provision for deferred federal and state income taxes and
investment tax credits, net 37,873 213,955 143,604
Pension and other retirement benefit plan non-cash expense 176,352 168,689 281,471
Cash paid to pension and other retirement benefit
plan trusts (188,616) (200,084) (370,823)
Changes in operating assets and liabilities:
Accounts receivable, net (218,932) (32,843) (93,304)
Materials and supplies (26,264) (1,002) (5,978)
Accounts payable and accrued expenses 193,615 58,301 (105,432)
Accrued interest and taxes (20,473) (28,754) (63,192)
Pension and postretirement regulatory assets (18,813) 3,472 (5,432)
Purchased power obligations (9,697) (104,694) (111,621)
Other, net (59,726) 24,083 (1,593)
Net cash provided by operating activities 1,354,220 1,356,423 574,603
Investing activities
Construction additions (679,785) (592,160) (552,293)
Sale of assets 2,268 7,649 11,977
Change in restricted cash (64,977)
1,916 8,399
Other, net (39,729) (28,271) (8,050)
Net cash used in investing activities (782,223) (610,866) (539,967)
Financing activities
Dividends paid on preferred stock (2,210) (3,461) (5,095)
Dividends paid on common stock (55,000) (218,100) -
Dividends paid on common stock of minority interests (3,822) (4,918) (3,801)
Reductions in long-term debt (632,725) (669,267) (1,812,085)
Proceeds from long-term debt 28,000 52,775 1,659,360
Redemption of preferred stock - (25,316) (40,495)
Buyback of minority interest common stock (1,158) (6,730) (3,454)
Net change in short-term debt to affiliates (43,000) 234,732 273,134
Other, net (528) 6,221 6
Net cash (used in) provided by financing activities (710,443) (634,064) 67,570
Net increase in cash and cash equivalents (138,446) 111,493 102,206
Cash and cash equivalents, beginning of period 354,578 243,085 140,879
Cash and cash equivalents, end of period 216,132$ 354,578$ 243,085$
Supplemental disclosures of cash flow information:
Interest paid 279,224$ 285,578$ 366,489$
Taxes paid 157,250 108,129 188,608
For the years ended March 31,
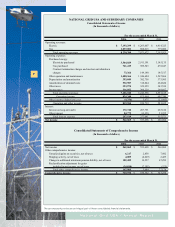
NATIONAL GRID USA AND SUBSIDIARY COMPANIES
Consolidated Statements of Cash Flow
(In thousands of dollars)