National Grid 2005 Annual Report Download - page 48
Download and view the complete annual report
Please find page 48 of the 2005 National Grid annual report below. You can navigate through the pages in the report by either clicking on the pages listed below, or by using the keyword search tool below to find specific information within the annual report.-
 1
1 -
2
-
3
-
4
-
5
-
6
-
7
-
8
-
9
-
10
-
11
-
12
-
13
-
14
-
15
-
16
-
17
-
18
-
19
-
20
-
21
-
22
-
23
-
24
-
25
-
26
-
27
-
28
-
29
-
30
-
31
-
32
-
33
-
34
-
35
-
36
-
37
-
 38
38 -
 39
39 -
 40
40 -
 41
41 -
 42
42 -
 43
43 -
 44
44 -
 45
45 -
 46
46 -
 47
47 -
 48
48 -
 49
49 -
 50
50 -
 51
51 -
 52
52 -
 53
53 -
 54
54 -
 55
55 -
 56
56 -
 57
57 -
 58
58 -
59
-
60
-
61
 |
 |

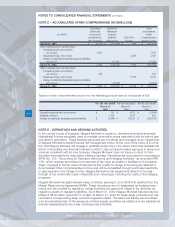
NOTES TO CONSOLIDATED FINANCIAL STATEMENTS (continued)
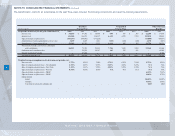
The benefit plans’ costs (for all subsidiaries) for the past three years included the following components and used the following assumptions.
48
National Grid USA / Annual Report
(in thousands)
Net periodic benefit cost, for the year ended March 31, 2005 2004 2003 2005 2004 2003 2005 2004
Service cost 50,656$ 47,342$ 38,998$ 690$ 647$ 563$ 22,200$ 17,930$
Interes t cos t 144,100 146,273 154,127 6,149 6,578 7,133 103,810 98,849
Expected return on plan assets (165,347) (160,892) (177,226) - - - (73,880) (60,957)
Amortization of unrecognized prior service cost 3,459 2,809 1,681 (149) (149) (149) 4,678 (687)
Amortization of unrecognized loss 53,385 43,789 5,511 1,016 582 103 36,756 36,531
Net periodic benefit costs before settlements
and curtailments 86,253 79,321 23,091 7,706 7,658 7,650 93,564 91,666
Settlement and curtailment loss - 22,922 29,187 185 222 361 - 16,066
Special termination benefits - 91,855 - - - - - 8,936
Net periodic benefit cost 86,253$ 194,098$ 52,278$ 7,891$ 7,880$ 8,011$ 93,564$ 116,668$
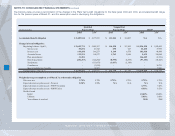
Weighted average assumptions used to determine net periodic cost:
Discount rate 5.75% 6.25% 7.50% 5.75% 6.25% 7.50% 5.75% 6.25%
Rate of compensation increase - New England 4.70% 4.63% 4.63% 5.25% 4.63% 5.25% N/A N/A
Rate of compensation increase - New York 3.25% 3.25% 3.25% 5.25% 5.25% 5.25% N/A N/A
Expected return on plan assets - Pension 8.50% 8.50% 8.75% N/A N/A N/A N/A N/A
Expected return on plan assets - PBOP 6.50% 7.25%
Expected return on plan assets - PBOP 9.00% 8.75%
Medical trend
Initial 10.00% 10.00%
Ultimate 5.00% 5.00%
Year that trend reaches ultimate rate 2009 2008
Other Retiremen
Pension Plans
Qualified
Nonqualified
Pension Plans
Benefits