National Grid 2005 Annual Report Download - page 15
Download and view the complete annual report
Please find page 15 of the 2005 National Grid annual report below. You can navigate through the pages in the report by either clicking on the pages listed below, or by using the keyword search tool below to find specific information within the annual report.-
 1
1 -
2
-
3
-
4
-
 5
5 -
 6
6 -
 7
7 -
 8
8 -
 9
9 -
 10
10 -
 11
11 -
 12
12 -
 13
13 -
 14
14 -
 15
15 -
 16
16 -
 17
17 -
 18
18 -
 19
19 -
 20
20 -
 21
21 -
 22
22 -
 23
23 -
 24
24 -
 25
25 -
26
-
27
-
28
-
29
-
30
-
31
-
32
-
33
-
34
-
35
-
36
-
37
-
38
-
39
-
40
-
41
-
42
-
43
-
44
-
45
-
46
-
47
-
48
-
49
-
50
-
51
-
52
-
53
-
54
-
55
-
56
-
57
-
58
-
59
-
60
-
61
 |
 |

day to the current temperature, and if the current temperature is 2.2% higher or lower than the
historical average the Company will either surcharge (due to lower throughput) or discount (due to
greater throughput) the customer.
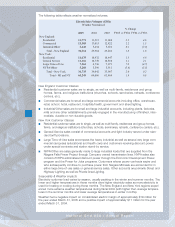
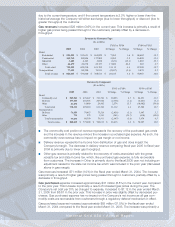
Gas revenues increased $28 million (3.6%) in the current year. This increase is primarily a result of
higher gas prices being passed through to the customers, partially offset by a decrease in
throughput.
■The commodity cost portion of revenue represents the recovery of the purchased gas costs
and the increase in the revenue mirrors the increase in purchased gas expense. As such, the
commodity cost revenue has no impact on gas margin or net income.
■Delivery revenue represents the income from distribution of gas and does impact the
Company’s margin. The decrease in delivery revenue comparing fiscal year 2005 to fiscal year
2004 is primarily due to lower gas throughput.
■Other gas revenue is primarily related to the recovery of costs associated with the gross-
receipts tax and state income tax, which, like purchased gas expense, is fully recoverable
from customers. The increase in Other is primarily due to the fiscal 2005 year not including an
adjustment related to the state net income tax which was included in the prior year (discussed
above in gas margin).
Gas revenues increased $71 million (10%) in the fiscal year ended March 31, 2004. The increase
was primarily a result of higher gas prices being passed through to customers, partially offset by a
decrease in throughput.
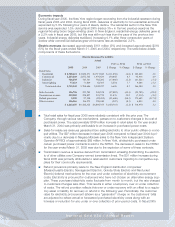
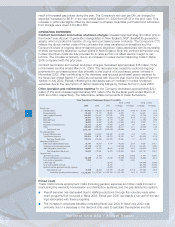
Gas purchased expense increased approximately $31 million (6.5%) in the current year compared
to the prior year. This increase is primarily a result of increased gas prices during the year. The
Company’s net cost per Dth, as charged to expense, increased to $7.12 in the year ended March
31, 2005 from $6.61 in the prior year. This increase in price was slightly offset by decreased pur-
chases. Gas purchased expense has no impact on the Company’s net income as all gas com-
modity costs are recoverable from customers through a regulatory deferral mechanism in effect.
Gas purchased expense increased approximately $85 million (21.5%) in the fiscal year ended
March 31, 2004 compared to the fiscal year ended March 31, 2003. The increase was primarily a
15
National Grid USA / Annual Report
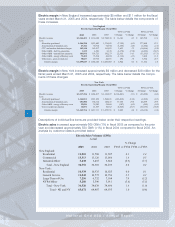
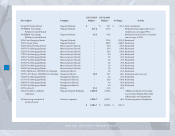
2005 2004 2003 $ Change % Change $ Change % Change
Retail
Residential 521,593$ 513,631$ 465,029$ 7,962$ 1.6 48,602$ 10.5
Commercial 160,768 154,806 137,908 5,962 3.9 16,898 12.3
Industrial 3,482 4,103 3,038 (621) (15.1) 1,065 35.1
Other
44,479 26,670 25,727 17,809 66.8 943 3.7
Total retail 730,322 699,210 631,702 31,112 4.4 67,508 10.7
Transportation
77,693 80,390 76,911 (2,697) (3.4) 3,479 4.5
Total revenue
808,015$ 779,600$ 708,613$ 28,415$ 3.6 70,987$ 10.0
FY05 vs FY04
FY04 vs FY03
Revenue by Customer Type
($'s in 000's)
2005 2004 2003 $ Change % Change $ Change % Change
Retail
Commodity cost 509,543$ 478,647$ 393,796$ 30,896$ 6.5 84,851$ 21.5
Delivery 199,145 201,503 207,944 (2,358) (1.2) (6,441) (3.1)
Other
21,634 19,060 29,962 2,574 13.5 (10,902) (36.4)
Total retail 730,322 699,210 631,702 31,112 4.4 67,508 10.7
Transportation
Delivery 76,959 79,415 75,518 (2,456) (3.1) 3,897 5.2
Other
734 975 1,393 (241) (24.7) (418) (30.0)
Total transportation
77,693 80,390 76,911 (2,697) (3.4) 3,479 4.5
Total revenue
808,015$ 779,600$ 708,613$ 28,415$ 3.6 70,987$ 10.0
FY05 vs FY04
FY04 vs FY03
Revenue by Component
($'s in 000's)