National Grid 2005 Annual Report Download - page 12
Download and view the complete annual report
Please find page 12 of the 2005 National Grid annual report below. You can navigate through the pages in the report by either clicking on the pages listed below, or by using the keyword search tool below to find specific information within the annual report.-
 1
1 -
 2
2 -
 3
3 -
 4
4 -
 5
5 -
 6
6 -
 7
7 -
 8
8 -
 9
9 -
 10
10 -
 11
11 -
 12
12 -
 13
13 -
 14
14 -
 15
15 -
 16
16 -
 17
17 -
 18
18 -
 19
19 -
 20
20 -
 21
21 -
 22
22 -
23
-
24
-
25
-
26
-
27
-
28
-
29
-
30
-
31
-
32
-
33
-
34
-
35
-
36
-
37
-
38
-
39
-
40
-
41
-
42
-
43
-
44
-
45
-
46
-
47
-
48
-
49
-
50
-
51
-
52
-
53
-
54
-
55
-
56
-
57
-
58
-
59
-
60
-
61
 |
 |

Economic impacts
During fiscal year 2005, the New York region began recovering from the industrial recession during
fiscal years 2003 and 2004. During fiscal 2005, deliveries of electricity to non-residential accounts
expanded by 5.3% following four years of steady decline. The residential sector in the New York
service area expanded 1.3% during fiscal 2005 (versus 3%+ in the two previous years) as the
regional housing boom began winding down. In New England, residential energy deliveries grew at
a 2.2% rate in fiscal year 2005, but this was still much less than the pace of the previous two
years. Industrial energy deliveries stabilized, increasing 0.1% after three consecutive years of
decline while commercial deliveries grew at the same rate as residential, 2.2%.
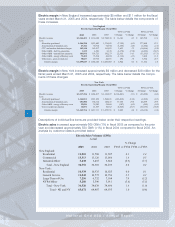
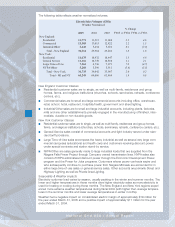
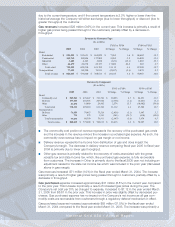
Electric revenues decreased approximately $151 million (2%) and increased approximately $319
(5%) for the fiscal years ended March 31, 2005 and 2004, respectively. The table below details
components of these fluctuations.
■Total retail sales for fiscal year 2005 were relatively consistent with the prior year. The
Company, through various rate mechanisms, passes on to customers changes in its cost of
purchased power. The approximately $166 million increase in retail sales for the year ended
March 31, 2004 was primarily attributable to an increase in purchased power costs.
■Sales for resale are revenues generated from selling electricity to other public utilities or munic-
ipal utilities. The $97 million decrease in fiscal year 2005 compared to fiscal year 2004 is pri-
marily due to a decrease in Niagara Mohawk sales to the New York Independent System
Operator (NYISO) of approximately $89 million. In New York, all electricity purchased under
certain purchased power contracts is sold to the NYISO. The decrease in sales to the NYISO
for the year ended March 31, 2005 was due to the expiration of some of these contracts.
■Transmission revenue is revenue derived from transmission wheeling (transmitting the electrici-
ty of other utilities over Company-owned transmission lines). The $31 million increase during
fiscal 2005 was primarily attributable to retail electric customers migrating to competitive sup-
pliers for their commodity requirements.
■Refund provisions primarily relate to the New England distribution companies’
(Massachusetts Electric, Narragansett Electric, Granite State Electric and Nantucket
Electric) deferral mechanisms for the over and under collection of electricity procurement
costs. Electricity is procured for customers who have not chosen an alternative energy sup-
plier. These purchased electricity costs fluctuate from month to month, but the rate charged
to customers changes less often. This results in either a temporary over or under collection
of costs. The refund provision reflects this over or under recovery with an offset to a regula-
tory asset or liability for recovery or refund in the following year. Periodically, the customer
rates for electricity procurement (shown as a “generation” charge on the customers’ bills)
are adjusted to reflect actual or forecasted purchased electricity costs along with an
increase or reduction for any under or over collection of prior period costs. In fiscal 2005
12
National Grid USA / Annual Report
Electric Revenue ($'s in 000's)
Actual
2005 2004 2003 $ Change % Change $ Change % Change
Retail Sales
Residential 2,708,421$ 2,820,271$ 2,717,843$ (111,850)$ (4.0) 102,428$ 3.8
Commercial 2,203,203 2,072,745 1,976,829 130,458 6.3 95,916 4.9
Industrial 726,295 743,761 785,282 (17,466) (2.3) (41,521) (5.3)
Street lighting
77,423 71,869 62,303 5,554 7.7 9,566 15.4
Total retail sales 5,715,342 5,708,646 5,542,257 6,696 0.1 166,389 3.0
Sales for resale 126,706 223,789 249,574 (97,083) (43.4) (25,785) (10.3)
Transmission revenue 259,903 228,427 235,739 31,476 13.8 (7,312) (3.1)
Refund provisions 5,590 97,190 (82,455) (91,600) (94.2) 179,645 (217.9)
Other revenues
156,066 156,273 150,240 (207) (0.1) 6,033 4.0
6,263,607$ 6,414,325$ 6,095,355$ (150,718)$ (2.3) 318,970$ 5.2
FY05 vs FY04
FY04 vs FY03