National Grid 2005 Annual Report Download - page 16
Download and view the complete annual report
Please find page 16 of the 2005 National Grid annual report below. You can navigate through the pages in the report by either clicking on the pages listed below, or by using the keyword search tool below to find specific information within the annual report.-
 1
1 -
2
-
3
-
4
-
5
-
 6
6 -
 7
7 -
 8
8 -
 9
9 -
 10
10 -
 11
11 -
 12
12 -
 13
13 -
 14
14 -
 15
15 -
 16
16 -
 17
17 -
 18
18 -
 19
19 -
 20
20 -
 21
21 -
 22
22 -
 23
23 -
 24
24 -
 25
25 -
 26
26 -
27
-
28
-
29
-
30
-
31
-
32
-
33
-
34
-
35
-
36
-
37
-
38
-
39
-
40
-
41
-
42
-
43
-
44
-
45
-
46
-
47
-
48
-
49
-
50
-
51
-
52
-
53
-
54
-
55
-
56
-
57
-
58
-
59
-
60
-
61
 |
 |

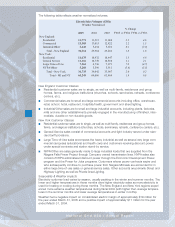
result of increased gas prices during the year. The Company’s net cost per Dth, as charged to
expense, increased to $6.61 in the year ended March 31, 2004 from $5.57 in the prior year. This
increase in price was slightly offset by decreased purchases. Quantities purchased and withdrawn
from storage were down 3.6 million Dth.
OPERATING EXPENSES
Contract termination and nuclear shutdown charges increased approximately $4 million (3%) in
the current year. As part of generation deregulation in New England, NEP divested its generation
assets, which included the transfer of long-term purchased power contracts. The Company’s CTC
reflects the above market costs of the contracts that were transferred at divestiture and the
Company’s share of ongoing decommissioning and shutdown costs associated with its ownership
of three permanently shutdown nuclear plants in New England. Both the contract termination and
nuclear shutdown costs are fully provided for in rates and do not affect electric margin or net
income. The increase is primarily due to an increase in nuclear decommissioning costs in fiscal
2005 compared with the prior year.
Contract termination and nuclear shutdown charges decreased approximately $16 million (10%)
in the twelve months ended March 31, 2004. The decrease was caused by reduced ongoing
payments for purchased power due primarily to the buyout of a purchased power contract in
November 2002. Also contributing to the decrease was reduced purchased power expense for
the fiscal year ended March 31, 2004 as compared with the prior year due to the sale of Vermont
Yankee in July 2002. Partially offsetting the decreases was an increase in nuclear shutdown
expenses due to the resumption of decommissioning billings by Yankee Atomic in June 2003.
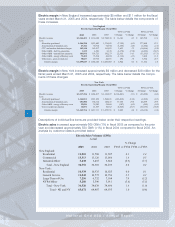
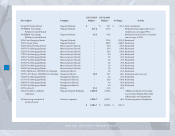
Other operation and maintenance expense for the Company decreased approximately $221
million (14%) and increased approximately $52 million (3%) for the fiscal years ended March 31,
2005 and 2004, respectively. The table below details components of these fluctuations.
Period costs
These costs include employment costs (including pension expense) and other costs incurred in
maintaining the electricity transmission and distribution systems, and the gas distribution system.
■Payroll expense has decreased due to staffing reductions through the voluntary early retire-
ment programs that occurred in fiscal 2004. Fiscal year 2005 represents a full year of the sav-
ings associated with these programs.
■The increase in employee benefits comparing fiscal year 2004 to fiscal year 2003 was
primarily due to a decrease in the discount rate used to calculate the expense and the
16
National Grid USA / Annual Report
2005 2004 2003 $ Change % Change $ Change % Change
Period costs:
Payroll expense 490,422$ 548,524$ 553,961$ (58,102)$ (10.6) (5,437)$ (1.0)
Pension benefits 59,468 55,173 28,202 4,295 7.8 26,971 95.6
Other employee benefits 113,981 114,551 117,921 (570) (0.5) (3,370) (2.9)
Bad debt 69,875 85,028 67,306 (15,153) (17.8) 17,722 26.3
Rent and leases 40,806 39,520 43,713 1,286 3.3 (4,193) (9.6)
Insurance 35,006 46,467 36,480 (11,461) (24.7) 9,987 27.4
Regulatory commission fees 24,711 22,507 19,866 2,204 9.8 2,641 13.3
Other
210,486 183,873 186,805 26,613 14.5 (2,932) (1.6)
Total period costs 1,044,755 1,095,643 1,054,254 (50,888) (4.6) 41,389 3.9
Pass-through items:
Energy efficiency costs 111,498 112,817 105,542 (1,319) (1.2) 7,275 6.9
Transmission expenses
181,076 158,721 192,273 22,355 14.1 (33,552) (17.5)
Total pass-through items 292,574 271,538 297,815 21,036 7.7 (26,277) (8.8)
Integration-related costs:
ERP system implementation costs 14,787 18,813 9,147 (4,026) (21.4) 9,666 105.7
Voluntary early retirement program (25,112) 116,857 - (141,969) (121.5) 116,857 100.0
Other integration related costs
26,965 36,171 46,978 (9,206) (25.5) (10,807) (23.0)
Total integration-related costs 16,640 171,841 56,125 (155,201) (90.3) 115,716 206.2
Atypical costs:
April 2003 ice storm - 5,700 - (5,700) (100.0) 5,700 100.0
Pension settlement (recovery)/losses (14,485) 23,144 29,548 (37,629) (162.6) (6,404) (21.7)
Loss on sale of properties 7,200 - - 7,200 100.0 - -
CWIP write-off - - 18,960 - - (18,960) (100.0)
New York bad debt write-off - - 42,376 - - (42,376) (100.0)
Seabrook nuclear generation facility expenses
- - 16,705 - - (16,705) (100.0)
Total atypical costs
(7,285) 28,844 107,589 (36,129) (125.3) (78,745) (73.2)
Total other operating and maintenance
1,346,684$ 1,567,866$ 1,515,783$ (221,182)$ (14.1) 52,083$ 3.4
Other Operations & Maintenance Expense ($'s in 000's)
FY05 vs FY04
FY04 vs FY03