Motorola 2012 Annual Report Download - page 83
Download and view the complete annual report
Please find page 83 of the 2012 Motorola annual report below. You can navigate through the pages in the report by either clicking on the pages listed below, or by using the keyword search tool below to find specific information within the annual report.-
 1
1 -
2
-
3
-
4
-
5
-
6
-
7
-
8
-
9
-
10
-
11
-
12
-
13
-
14
-
15
-
16
-
17
-
18
-
19
-
20
-
21
-
22
-
23
-
24
-
25
-
26
-
27
-
28
-
29
-
30
-
31
-
32
-
33
-
34
-
35
-
36
-
37
-
38
-
39
-
40
-
41
-
42
-
43
-
44
-
45
-
46
-
47
-
48
-
49
-
50
-
51
-
52
-
53
-
54
-
55
-
56
-
57
-
58
-
59
-
60
-
61
-
62
-
63
-
64
-
65
-
66
-
67
-
68
-
69
-
70
-
71
-
72
-
 73
73 -
 74
74 -
 75
75 -
 76
76 -
 77
77 -
 78
78 -
 79
79 -
 80
80 -
 81
81 -
 82
82 -
 83
83 -
 84
84 -
 85
85 -
 86
86 -
 87
87 -
 88
88 -
 89
89 -
 90
90 -
 91
91 -
 92
92 -
 93
93 -
94
-
95
-
96
-
97
-
98
-
99
-
100
-
101
-
102
-
103
-
104
-
105
-
106
-
107
-
108
-
109
-
110
-
111
-
112
-
113
-
114
-
115
-
116
-
117
-
118
-
119
-
120
 |
 |

75
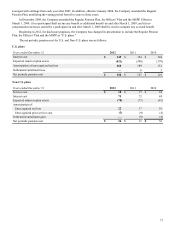
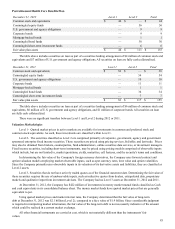
In April 2011, the Company recognized a curtailment gain in its United Kingdom defined benefit plan, and a settlement
loss in its Japanese defined benefit plan, due to the sale of certain assets of the Networks business. As a result, the Company
recorded a net gain to its consolidated statement of operations of $9 million.
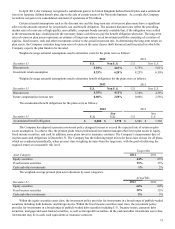
Certain actuarial assumptions such as the discount rate and the long-term rate of return on plan assets have a significant
effect on the amounts reported for net periodic cost and benefit obligation. The assumed discount rates reflect the prevailing
market rates of a universe of high-quality, non-callable, corporate bonds currently available that, if the obligation were settled
at the measurement date, would provide the necessary future cash flows to pay the benefit obligation when due. The long-term
rates of return on plan assets represents an estimate of long-term returns on an investment portfolio consisting of a mixture of
equities, fixed income, cash and other investments similar to the actual investment mix. In determining the long-term return on
plan assets, the Company considers long-term rates of return on the asset classes (both historical and forecasted) in which the
Company expects the plan funds to be invested.
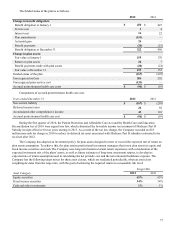
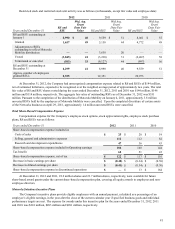
Weighted average actuarial assumptions used to determine costs for the plans were as follows:
2012 2011
December 31 U.S. Non U.S. U.S. Non U.S.
Discount rate 5.10% 4.61% 5.75% 5.01%
Investment return assumption 8.25% 6.24% 8.25% 6.50%
Weighted average actuarial assumptions used to determine benefit obligations for the plans were as follows:
2012 2011
December 31 U.S. Non U.S. U.S. Non U.S.
Discount rate 4.35% 4.11% 5.10% 4.58%
Future compensation increase rate 0.00% 2.58% 0.00% 2.56%
The accumulated benefit obligations for the plans were as follows:
2012 2011
December 31 U.S.
Non
U.S. U.S.
Non
U.S.
Accumulated benefit obligation $ 8,288 $ 1,770 $ 6,986 $ 1,588
The Company has adopted a pension investment policy designed to meet or exceed the expected rate of return on plan
assets assumption. To achieve this, the pension plans retain professional investment managers that invest plan assets in equity,
fixed income securities, and cash. In addition, some plans invest in insurance contracts. The Company’s measurement date of
its plan assets and obligations is December 31. The Company has the following target mixes for these asset classes for all plans,
which are readjusted periodically, when an asset class weighting deviates from the target mix, with the goal of achieving the
required return at a reasonable risk level:
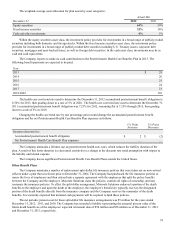
Target Mix
Asset Category 2012 2011
Equity securities 64% 63%
Fixed income securities 35% 35%
Cash and other investments 1% 2%
The weighted-average pension plan asset allocation by asset categories:
Actual Mix
December 31 2012 2011
Equity securities 64% 60%
Fixed income securities 34% 35%
Cash and other investments 2% 5%
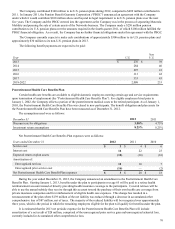
Within the equity securities asset class, the investment policy provides for investments in a broad range of publicly-traded
securities including both domestic and foreign stocks. Within the fixed income securities asset class, the investment policy
provides for investments in a broad range of publicly-traded debt securities including U.S. Treasury issues, corporate debt
securities, mortgage and asset-backed securities, as well as foreign debt securities. In the cash and other investments asset class,
investments may be in cash, cash equivalents or insurance contracts.