Motorola 2012 Annual Report Download - page 71
Download and view the complete annual report
Please find page 71 of the 2012 Motorola annual report below. You can navigate through the pages in the report by either clicking on the pages listed below, or by using the keyword search tool below to find specific information within the annual report.-
 1
1 -
2
-
3
-
4
-
5
-
6
-
7
-
8
-
9
-
10
-
11
-
12
-
13
-
14
-
15
-
16
-
17
-
18
-
19
-
20
-
21
-
22
-
23
-
24
-
25
-
26
-
27
-
28
-
29
-
30
-
31
-
32
-
33
-
34
-
35
-
36
-
37
-
38
-
39
-
40
-
41
-
42
-
43
-
44
-
45
-
46
-
47
-
48
-
49
-
50
-
51
-
52
-
53
-
54
-
55
-
56
-
57
-
58
-
59
-
60
-
 61
61 -
 62
62 -
 63
63 -
 64
64 -
 65
65 -
 66
66 -
 67
67 -
 68
68 -
 69
69 -
 70
70 -
 71
71 -
 72
72 -
 73
73 -
 74
74 -
 75
75 -
 76
76 -
 77
77 -
 78
78 -
 79
79 -
 80
80 -
 81
81 -
82
-
83
-
84
-
85
-
86
-
87
-
88
-
89
-
90
-
91
-
92
-
93
-
94
-
95
-
96
-
97
-
98
-
99
-
100
-
101
-
102
-
103
-
104
-
105
-
106
-
107
-
108
-
109
-
110
-
111
-
112
-
113
-
114
-
115
-
116
-
117
-
118
-
119
-
120
 |
 |

63
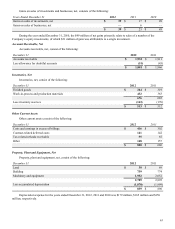
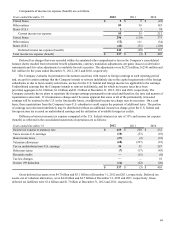
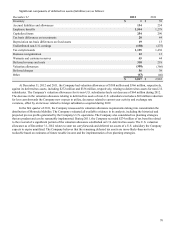
Gains on sales of investments and businesses, net, consists of the following:
Years Ended December 31 2012 2011 2010
Gains on sales of investments, net $39
$17$49
Gains on sales of businesses, net —6—
$39
$23$49
During the year ended December 31, 2010, the $49 million of net gains primarily relate to sales of a number of the
Company’s equity investments, of which $31 million of gain was attributable to a single investment.
Accounts Receivable, Net
Accounts receivable, net, consist of the following:
December 31 2012 2011
Accounts receivable $ 1,932 $ 1,911
Less allowance for doubtful accounts (51)(45)
$ 1,881 $ 1,866
Inventories, Net
Inventories, net, consist of the following:
December 31 2012 2011
Finished goods $ 244 $ 319
Work-in-process and production materials 432 363
676 682
Less inventory reserves (163)(170)
$ 513 $ 512
Other Current Assets
Other current assets consist of the following:
December 31 2012 2011
Costs and earnings in excess of billings $ 416 $ 302
Contract-related deferred costs 141 142
Tax-related refunds receivable 95 85
Other 148 157
$ 800 $ 686
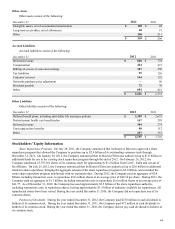
Property, Plant and Equipment, Net
Property, plant and equipment, net, consist of the following:
December 31 2012 2011
Land $38
$69
Building 739 774
Machinery and equipment 1,932 2,052
2,709 2,895
Less accumulated depreciation (1,870)(1,999)
$ 839 $ 896
Depreciation expense for the years ended December 31, 2012, 2011 and 2010 was $179 million, $165 million and $150
million, respectively.