Motorola 2012 Annual Report Download - page 31
Download and view the complete annual report
Please find page 31 of the 2012 Motorola annual report below. You can navigate through the pages in the report by either clicking on the pages listed below, or by using the keyword search tool below to find specific information within the annual report.-
 1
1 -
2
-
3
-
4
-
5
-
6
-
7
-
8
-
9
-
10
-
11
-
12
-
13
-
14
-
15
-
16
-
17
-
18
-
19
-
20
-
 21
21 -
 22
22 -
 23
23 -
 24
24 -
 25
25 -
 26
26 -
 27
27 -
 28
28 -
 29
29 -
 30
30 -
 31
31 -
 32
32 -
 33
33 -
 34
34 -
 35
35 -
 36
36 -
 37
37 -
 38
38 -
 39
39 -
 40
40 -
 41
41 -
42
-
43
-
44
-
45
-
46
-
47
-
48
-
49
-
50
-
51
-
52
-
53
-
54
-
55
-
56
-
57
-
58
-
59
-
60
-
61
-
62
-
63
-
64
-
65
-
66
-
67
-
68
-
69
-
70
-
71
-
72
-
73
-
74
-
75
-
76
-
77
-
78
-
79
-
80
-
81
-
82
-
83
-
84
-
85
-
86
-
87
-
88
-
89
-
90
-
91
-
92
-
93
-
94
-
95
-
96
-
97
-
98
-
99
-
100
-
101
-
102
-
103
-
104
-
105
-
106
-
107
-
108
-
109
-
110
-
111
-
112
-
113
-
114
-
115
-
116
-
117
-
118
-
119
-
120
 |
 |

23
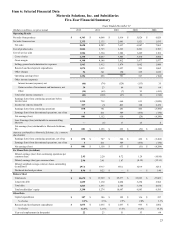
Item 6: Selected Financial Data
Motorola Solutions, Inc. and Subsidiaries
Five-Year Financial Summary
Years Ended December 31
(Dollars in millions, except as noted) 2012 2011 2010 2009 2008
Operating Results
Net sales from products $ 6,363 $ 6,068 $ 5,616 $ 5,026 $ 6,026
Net sales from services 2,335 2,135 2,001 1,921 1,835
Net sales 8,698 8,203 7,617 6,947 7,861
Cost of product sales 2,844 2,723 2,523 2,221 2,703
Cost of service sales 1,506 1,334 1,282 1,249 1,181
Costs of sales 4,350 4,057 3,805 3,470 3,884
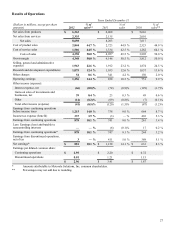
Gross margin 4,348 4,146 3,812 3,477 3,977
Selling, general and administrative expenses 1,963 1,912 1,874 1,662 1,800
Research and development expenditures 1,075 1,035 1,037 993 1,062
Other charges 54 341 150 255 1,819
Operating earnings (loss) 1,256 858 751 567 (704)
Other income (expense):
Interest income (expense), net (66) (74) (129) (133) 35
Gains on sales of investments and businesses, net 39 23 49 108 64
Other (14) (69) (7) 91 (415)
Total other income (expense) (41) (120) (87) 66 (316)
Earnings (loss) from continuing operations before
income taxes 1,215 738 664 633 (1,020)
Income tax expense (benefit) 337 (3) 403 188 2,470
Earnings (loss) from continuing operations 878 741 261 445 (3,490)
Earnings (loss) from discontinued operations, net of tax 3411 389 (473) (750)
Net earnings (loss) 881 1,152 650 (28) (4,240)
Less: Earnings (loss) attributable to noncontrolling
interests —(6) 17 23 4
Net earnings (loss) attributable to Motorola Solutions,
Inc. $ 881 $ 1,158 $ 633 $ (51) $ (4,244)
Amounts attributable to Motorola Solutions, Inc. common
shareholders
Earnings (loss) from continuing operations, net of tax $ 878 $ 747 $ 244 $ 422 $ (3,494)
Earnings (loss) from discontinued operations, net of tax 3411 389 (473) (750)
Net earnings (loss) $ 881 $ 1,158 $ 633 $ (51) $ (4,244)
Per Share Data (in dollars)
Diluted earnings (loss) from continuing operations per
common share 2.95 2.20 0.72 1.28 (10.80)
Diluted earnings (loss) per common share 2.96 3.41 1.87 (0.15) (13.11)
Diluted weighted average common shares outstanding
(in millions) 297.4 339.7 338.1 329.9 323.6
Dividends declared per share $ 0.96 $ 0.22 $ — $ — $ 1.40
Balance Sheet
Total assets $ 12,679 $ 13,929 $ 25,577 $ 25,603 $ 27,869
Long-term debt 1,859 1,130 2,098 3,258 3,982
Total debt 1,863 1,535 2,703 3,794 4,074
Total stockholders’ equity 3,290 5,274 10,987 9,883 9,595
Other Data
Capital expenditures $ 187 $ 186 $ 192 $ 136 $ 257
% of sales 2.1% 2.3% 2.5% 2.0% 3.3%
Research and development expenditures $ 1,075 $ 1,035 $ 1,037 $ 993 $ 1,062
% of sales 12.4% 12.6% 13.6% 14.3% 13.5%
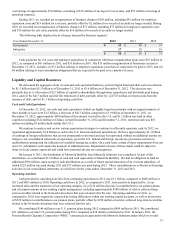
Year-end employment (in thousands) 22 23 51 53 64