Motorola 2012 Annual Report Download - page 38
Download and view the complete annual report
Please find page 38 of the 2012 Motorola annual report below. You can navigate through the pages in the report by either clicking on the pages listed below, or by using the keyword search tool below to find specific information within the annual report.-
 1
1 -
2
-
3
-
4
-
5
-
6
-
7
-
8
-
9
-
10
-
11
-
12
-
13
-
14
-
15
-
16
-
17
-
18
-
19
-
20
-
21
-
22
-
23
-
24
-
25
-
26
-
27
-
 28
28 -
 29
29 -
 30
30 -
 31
31 -
 32
32 -
 33
33 -
 34
34 -
 35
35 -
 36
36 -
 37
37 -
 38
38 -
 39
39 -
 40
40 -
 41
41 -
 42
42 -
 43
43 -
 44
44 -
 45
45 -
 46
46 -
 47
47 -
 48
48 -
49
-
50
-
51
-
52
-
53
-
54
-
55
-
56
-
57
-
58
-
59
-
60
-
61
-
62
-
63
-
64
-
65
-
66
-
67
-
68
-
69
-
70
-
71
-
72
-
73
-
74
-
75
-
76
-
77
-
78
-
79
-
80
-
81
-
82
-
83
-
84
-
85
-
86
-
87
-
88
-
89
-
90
-
91
-
92
-
93
-
94
-
95
-
96
-
97
-
98
-
99
-
100
-
101
-
102
-
103
-
104
-
105
-
106
-
107
-
108
-
109
-
110
-
111
-
112
-
113
-
114
-
115
-
116
-
117
-
118
-
119
-
120
 |
 |
30
Enterprise segment driven by margin gains in certain product lines offset by the anticipated decline in iDEN, which has
historically yielded strong margins.
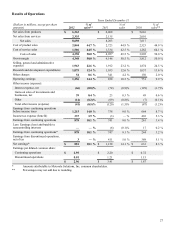
Selling, General and Administrative Expenses
SG&A expenses increased 2% to $1.9 billion, or 23.2% of net sales, in 2011, compared to $1.9 billion, or 24.5% of net
sales, in 2010. The increase in SG&A expenses reflects higher SG&A expenses in both segments, primarily due to (i) increased
sales incentives related to the increase in net sales and (ii) increased employee benefit-related expenses. The increases in
employee benefit-related expenses are primarily due to an increase in pension-related expenses and the reinstatement of our
401(k) matching contributions.
Research and Development Expenditures
R&D expenditures of $1.0 billion, or 12.6% of net sales were relatively flat in 2011, compared to $1.0 billion, or 13.6% of
net sales in 2010. R&D expenditures were flat in 2011 compared to 2010, which reflects higher R&D expenditures in the
Enterprise segment and lower R&D expenditures in the Government segment. The slight increase in the Enterprise segment
was primarily due to investment in next-generation technologies and increased employee benefit-related expenses. The
decrease in R&D expenditures in the Government segment was primarily due to savings from cost reduction initiatives related
to non employee expenses, partially offset by increased employee benefit expenses.
Other Charges
We recorded net charges of $341 million in Other charges in 2011, compared to net charges of $150 million in 2010. The
charges in 2011 included: (i) $200 million of charges relating to the amortization of intangibles, (ii) $88 million of net charges
relating to legal matters, (iii) $52 million of net reorganization of business charges included in Other charges, and (iv) $10
million related to a long term financing receivable reserve, partially offset by $9 million of gains related to pension plan
adjustments. The charges in 2010 included: (i) $203 million of charges relating to the amortization of intangibles, and (ii) $54
million of net reorganization of business charges included in Other charges, partially offset by: (i) $78 million of gains related
to intellectual property settlements and reserve adjustments, and (ii) $29 million of income related to a legal settlement. The net
reorganization of business charges are discussed in further detail in the “Reorganization of Businesses” section.
Net Interest Expense
Net interest expense was $74 million in 2011, compared to net interest expense of $129 million in 2010. Net interest
expense in 2011 included interest expense of $132 million, partially offset by interest income of $58 million. Net interest
expense in 2010 includes interest expense of $217 million, partially offset by interest income of $88 million. The decrease in
net interest expense in 2011 compared to 2010 is primarily attributable to lower interest expense driven by lower average debt
outstanding partially offset by a decrease in lower interest income driven by lower average cash and cash equivalents and lower
yields during 2011 compared to 2010.
Gains on Sales of Investments and Businesses
Gains on sales of investments and businesses were $23 million in 2011, compared to a gain of $49 million in 2010. In
2011, the net gain was primarily comprised of gains related to sales of certain of our equity investments. In 2010, the net gain
was primarily comprised of a gain on the sale of a single investment.
Other
Net Other expense was $69 million in 2011, compared to net Other expense of $7 million in 2010. The net Other expense
in 2011 was primarily comprised of an $81 million loss from the extinguishment of a portion of our outstanding long-term debt,
partially offset by an $8 million foreign currency gain. The net expense in 2010 was primarily comprised of: (i) $21 million of
investment impairments, and (ii) a $12 million loss from the extinguishment of a portion of our outstanding long-term debt,
partially offset by: (i) a $12 million foreign currency gain, and (ii) an $11 million gain from Sigma Fund investments.
Effective Tax Rate
We recorded $3 million of net tax benefit in 2011, resulting in a negative effective tax rate on continuing operations
compared to $403 million of net tax expense in 2010, resulting in an effective tax rate of 61%. Our negative effective tax rate in
2011 was primarily due to: (i) a $274 million tax benefit related to the reversal of a significant portion of the valuation
allowance established on the U.S. deferred tax assets, and (ii) reductions in unrecognized tax benefits for facts that now
indicate the extent to which certain tax positions are more-likely-than-not of being sustained, partially offset by an increase in
the U.S. federal income tax accrual for repatriation of undistributed foreign earnings.
Our effective tax rate for 2010 was higher than the U.S. statutory tax rate of 35% primarily due to (i) an increase in the
U.S. federal income tax accrual for repatriation of undistributed foreign earnings related to the realignment of our investment
structure in preparation of the distribution of Motorola Mobility, and (ii) a non-cash tax charge related to the Medicare Part D