Motorola 2012 Annual Report Download - page 40
Download and view the complete annual report
Please find page 40 of the 2012 Motorola annual report below. You can navigate through the pages in the report by either clicking on the pages listed below, or by using the keyword search tool below to find specific information within the annual report.-
 1
1 -
2
-
3
-
4
-
5
-
6
-
7
-
8
-
9
-
10
-
11
-
12
-
13
-
14
-
15
-
16
-
17
-
18
-
19
-
20
-
21
-
22
-
23
-
24
-
25
-
26
-
27
-
28
-
29
-
 30
30 -
 31
31 -
 32
32 -
 33
33 -
 34
34 -
 35
35 -
 36
36 -
 37
37 -
 38
38 -
 39
39 -
 40
40 -
 41
41 -
 42
42 -
 43
43 -
 44
44 -
 45
45 -
 46
46 -
 47
47 -
 48
48 -
 49
49 -
 50
50 -
51
-
52
-
53
-
54
-
55
-
56
-
57
-
58
-
59
-
60
-
61
-
62
-
63
-
64
-
65
-
66
-
67
-
68
-
69
-
70
-
71
-
72
-
73
-
74
-
75
-
76
-
77
-
78
-
79
-
80
-
81
-
82
-
83
-
84
-
85
-
86
-
87
-
88
-
89
-
90
-
91
-
92
-
93
-
94
-
95
-
96
-
97
-
98
-
99
-
100
-
101
-
102
-
103
-
104
-
105
-
106
-
107
-
108
-
109
-
110
-
111
-
112
-
113
-
114
-
115
-
116
-
117
-
118
-
119
-
120
 |
 |

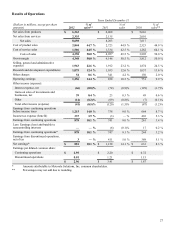
32
charges primarily from net charges related to legal matters. The decrease in R&D expenditures was primarily due to savings
from cost reduction initiatives related to non employee expenses partially offset by an increase in investment in next-generation
technologies and increased employee benefit-related expenses.
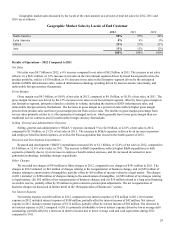
Enterprise Segment
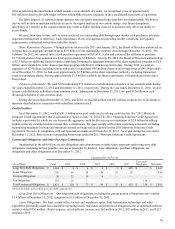
In 2012, the Enterprise segment’s net sales represented 31% of our consolidated net sales, compared to 35% in 2011, and
34% in 2010.
Years Ended December 31 Percent Change
(Dollars in millions) 2012 2011 2010 2012—2011 2011—2010
Segment net sales $ 2,709 $ 2,845 $ 2,568 (5)% 11%
Operating earnings 291 242 217 20 % 12%
Segment Results—2012 Compared to 2011
In 2012, the segment’s net sales were $2.7 billion, a 5% decrease compared to net sales of $2.8 billion in 2011. The 5%
decrease in net sales in the Enterprise segment reflects a decrease in sales of: (i) iDEN infrastructure, (ii) mobile computing,
and (iii)WLAN, partially offset by an increase in data capture equipment sales. The decrease in net sales for the segment
reflects a decline in North America, Latin America, and EMEA, and an increase in Asia. Net sales in North America continued
to comprise a significant portion of the segment’s business, accounting for approximately 47% of the segment’s net sales in
2012, and approximately 46% in 2011. The segment’s backlog was $782 million at December 31, 2012, compared to
$875 million at December 31, 2011. The decline in backlog is primarily related to the anticipated decline in iDEN
infrastructure and reduced information technology spending driven by macroeconomic uncertainty.
The segment had operating earnings of $291 million in 2012, compared to operating earnings of $242 million in 2011.
The increase in operating earnings was primarily due to a decrease in Other charges as a result of a reduction in intangibles
amortization as certain intangible assets are fully amortized, as well as a decline from net legal matters that occurred in 2011.
The decrease in Other charges was partially offset by: (i) a decrease in gross margin, primarily attributable to a decline in
volume, and unfavorable foreign currency fluctuations, (ii) increased SG&A expenses due to increases in pension and
employee benefit related expenses and the acquisition of Psion, and (iii) an increase in R&D expenditures, driven by higher
employee benefit expenses and increased investment in next-generation technologies, including the acquisition of Psion. As a
percentage of net sales in 2012 as compared to 2011, gross margin decreased primarily related to unfavorable foreign currency
fluctuations and product mix, and operating leverage decreased due to the 5% decline in net sales.
Segment Results—2011 Compared to 2010
In 2011, the segment’s net sales were $2.8 billion, an 11% increase compared to net sales of $2.6 billion in 2010. The 11%
increase in net sales in the Enterprise segment reflects an increase in mobile computing, WLAN and data capture equipment
sales, partially offset by a decline in iDEN. The increase in net sales for the segment reflects higher net sales in all regions. Net
sales in North America continued to comprise a significant portion of the segment’s business, accounting for approximately
46% of the segment’s net sales in 2011, and approximately 48% in 2010. The segment’s backlog was $875 million at
December 31, 2012, compared to $881 million at December 31, 2011.
The segment had operating earnings of $242 million in 2011, compared to operating earnings of $217 million in 2010. As
a percentage of net sales in 2011 as compared to 2010, gross margin was relatively flat and SG&A expenses and R&D
expenditures decreased. The increase in operating earnings was primarily due to an increase in gross margin, driven by the
11% increase in net sales, partially offset by: (i) increased SG&A expenses primarily due to an increase in sales incentives
related to the increase in net sales and increased employee benefit-related expenses, (ii) an increase in Other charges primarily
from net charges related to legal matters, and (iii) an increase in R&D expenditures primarily due to an increased investment in
next-generation technologies and increased employee benefit-related expenses.
Reorganization of Businesses
During 2012 we implemented various productivity improvement plans aimed at achieving long term, sustainable
profitability by driving efficiencies and reducing operating costs. In 2012, we recorded net reorganization of business charges
of $50 million relating to the separation of 1,000 employees, of which 700 were indirect employees and 300 were direct
employees. These charges included $9 million recorded to Costs of sales and $41 million of charges within Other charges in
our consolidated statements of operations. Included in the aggregate $50 million are charges of: (i) $54 million for employee
separation costs, and (ii) building impairment charges of $7 million, partially offset by $11 million of reversals for accruals no
longer needed.
We realized cost-saving benefits of approximately $17 million in 2012 from the plans that were initiated during 2012,
primarily in operating expenses. Beyond 2012, we expect the reorganization plans initiated during 2012 to provide annualized