Motorola 2012 Annual Report Download - page 37
Download and view the complete annual report
Please find page 37 of the 2012 Motorola annual report below. You can navigate through the pages in the report by either clicking on the pages listed below, or by using the keyword search tool below to find specific information within the annual report.-
 1
1 -
2
-
3
-
4
-
5
-
6
-
7
-
8
-
9
-
10
-
11
-
12
-
13
-
14
-
15
-
16
-
17
-
18
-
19
-
20
-
21
-
22
-
23
-
24
-
25
-
26
-
 27
27 -
 28
28 -
 29
29 -
 30
30 -
 31
31 -
 32
32 -
 33
33 -
 34
34 -
 35
35 -
 36
36 -
 37
37 -
 38
38 -
 39
39 -
 40
40 -
 41
41 -
 42
42 -
 43
43 -
 44
44 -
 45
45 -
 46
46 -
 47
47 -
48
-
49
-
50
-
51
-
52
-
53
-
54
-
55
-
56
-
57
-
58
-
59
-
60
-
61
-
62
-
63
-
64
-
65
-
66
-
67
-
68
-
69
-
70
-
71
-
72
-
73
-
74
-
75
-
76
-
77
-
78
-
79
-
80
-
81
-
82
-
83
-
84
-
85
-
86
-
87
-
88
-
89
-
90
-
91
-
92
-
93
-
94
-
95
-
96
-
97
-
98
-
99
-
100
-
101
-
102
-
103
-
104
-
105
-
106
-
107
-
108
-
109
-
110
-
111
-
112
-
113
-
114
-
115
-
116
-
117
-
118
-
119
-
120
 |
 |
29
Gains on Sales of Investments and Businesses
Gains on sales of investments and businesses were $39 million in 2012, compared to $23 million in 2011. In 2012 and
2011, the net gains were primarily comprised of gains related to sales of certain of our equity investments.
Other
Net Other expense was $14 million in 2012, compared to net Other expense of $69 million in 2011. The net Other expense
in 2012 was primarily comprised of: (i) $13 million foreign currency expense, (ii) $6 million loss from the extinguishment of
debt, and (iii) a $8 million investment write down expense, partially offset by $13 million of other net investment earnings. The
net Other expense in 2011 was primarily comprised of an $81 million loss from the extinguishment of a portion of our
outstanding long-term debt, partially offset by an $8 million foreign currency gain.
Effective Tax Rate
We recorded $337 million of net tax expense in 2012, resulting in an effective tax rate of 28%, compared to a $3 million
net tax benefit in 2011, resulting in a negative effective tax rate. Our effective tax rate in 2012 is lower than the U.S. statutory
tax rate of 35% primarily due to: (i) a $60 million tax benefit related to the reversal of a significant portion of the valuation
allowance established on certain foreign deferred tax assets, and (ii) a $13 million reduction in unrecognized tax benefits for
facts that now indicate the extent to which certain tax positions are more-likely-than-not of being sustained. Our negative
effective tax rate in 2011 was primarily due to: (i) a $274 million tax benefit related to the reversal of a significant portion of
the valuation allowance established on the U.S. deferred tax assets, and (ii) reductions in unrecognized tax benefits for facts
that now indicate the extent to which certain tax positions are more-likely-than-not of being sustained, partially offset by an
increase in the U.S. federal income tax accrual for repatriation of undistributed foreign earnings.
While our effective tax rate may change from period to period due to non-recurring events, such as settlements of income
tax audits and changes in valuation allowances, we generally expect our effective tax rate to be close to the U.S. statutory tax
rate primarily due to our current repatriation strategy and the U.S. federal income tax accrual on undistributed foreign earnings.
During 2012, the Company began to reorganize certain of its non-U.S. subsidiaries under a holding company structure in order
to facilitate the efficient movement of non-U.S. cash and provide a platform to fund foreign investments, such as potential
acquisitions and capital expenditures. When the reorganization is complete, the tax impact of future cash repatriations from
these subsidiaries may be more favorable than under the existing structure.
The valuation allowances on our deferred tax assets are discussed further in Note 6, “Income Taxes,” of our consolidated
financial statements. Our effective tax rate will change from period to period based on non-recurring events, such as the
settlement of income tax audits, changes in valuation allowances and the tax impact of significant unusual or extraordinary
items, as well as recurring factors including changes in the geographic mix of income and effects of various global income tax
strategies.
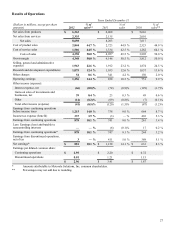
Earnings from Continuing Operations
After taxes, and excluding earnings attributable to noncontrolling interests, we had net earnings from continuing operations
of $878 million, or $2.95 per diluted share, in 2012, compared to $747 million, or $2.20 per diluted share, in 2011. The increase
in earnings from continuing operations in 2012 compared to 2011 was primarily attributable to: (i) $287 million decrease in
other charges related to lower intangible asset amortization and net legal and related insurance matters, and (ii) $202 million
increase in gross margin, partially offset by the $274 million benefit for the valuation allowance reversal recorded during 2011.
The increase in earnings per diluted share was primarily due to the increase in earnings from continuing operations and the
reduction in shares outstanding as a result of our share repurchase program.
Earnings from Discontinued Operations
After taxes, we had earnings from discontinued operations of $3 million, or $0.01 per diluted share, in 2012, compared to
earnings from discontinued operations of $411 million, or $1.21 per diluted share, in 2011. The earnings from discontinued
operations in 2011 were primarily from the operations of and the gain on the sale of the Networks business.
Results of Operations—2011 Compared to 2010
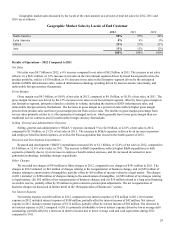
Net Sales
Net sales were $8.2 billion in 2011, an 8% increase compared to net sales of $7.6 billion in 2010. The increase in net sales
reflects: (i) a $309 million, or 6% increase in net sales in the Government segment and (ii) a $277 million, or 11% increase in
net sales in the Enterprise segment.
Gross Margin
Gross margin was $4.1 billion, or 50.5% of net sales in 2011, compared to $3.8 billion, or 50.0% of net sales, in 2010.
Gross margin dollars increased in both segments. The increase in gross margin as a percent of sales reflects higher gross margin
in the Government segment, driven by the increase in sales and favorable product mix, with margins remaining flat in the