Motorola 2012 Annual Report Download - page 75
Download and view the complete annual report
Please find page 75 of the 2012 Motorola annual report below. You can navigate through the pages in the report by either clicking on the pages listed below, or by using the keyword search tool below to find specific information within the annual report.-
 1
1 -
2
-
3
-
4
-
5
-
6
-
7
-
8
-
9
-
10
-
11
-
12
-
13
-
14
-
15
-
16
-
17
-
18
-
19
-
20
-
21
-
22
-
23
-
24
-
25
-
26
-
27
-
28
-
29
-
30
-
31
-
32
-
33
-
34
-
35
-
36
-
37
-
38
-
39
-
40
-
41
-
42
-
43
-
44
-
45
-
46
-
47
-
48
-
49
-
50
-
51
-
52
-
53
-
54
-
55
-
56
-
57
-
58
-
59
-
60
-
61
-
62
-
63
-
64
-
 65
65 -
 66
66 -
 67
67 -
 68
68 -
 69
69 -
 70
70 -
 71
71 -
 72
72 -
 73
73 -
 74
74 -
 75
75 -
 76
76 -
 77
77 -
 78
78 -
 79
79 -
 80
80 -
 81
81 -
 82
82 -
 83
83 -
 84
84 -
 85
85 -
86
-
87
-
88
-
89
-
90
-
91
-
92
-
93
-
94
-
95
-
96
-
97
-
98
-
99
-
100
-
101
-
102
-
103
-
104
-
105
-
106
-
107
-
108
-
109
-
110
-
111
-
112
-
113
-
114
-
115
-
116
-
117
-
118
-
119
-
120
 |
 |

67
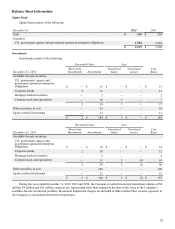
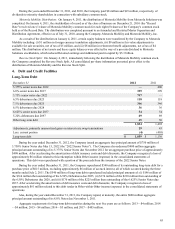
As part of its liability management program, one of the Company's European subsidiaries has outstanding interest rate
agreements (“Interest Agreements”) relating to Euro-denominated loans. The interest on the Euro-denominated loans is
variable. The Interest Agreements change the characteristics of interest rate payments from variable to maximum fixed-rate
payments. The Interest Agreements are not accounted for as a part of a hedging relationship and, accordingly, the changes in
the fair value of the Interest Agreements are included in Other income (expense) in the Company's consolidated statements of
operations. The weighted average fixed rate payment on the Interest Agreement for the year ended December 31, 2012 was
4.92%. The fair value of the Interest Agreements resulted in a liability position of $4 million at December 31, 2012, compared
to a liability position of $3 million at December 31, 2011.
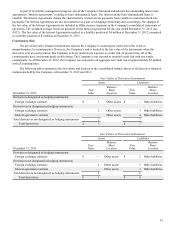
Counterparty Risk
The use of derivative financial instruments exposes the Company to counterparty credit risk in the event of
nonperformance by counterparties. However, the Company’s risk is limited to the fair value of the instruments when the
derivative is in an asset position. The Company actively monitors its exposure to credit risk. At present time, all of the
counterparties have investment grade credit ratings. The Company is not exposed to material credit risk with any single
counterparty. As of December 31, 2012, the Company was exposed to an aggregate net credit risk of approximately $3 million
with all counterparties.
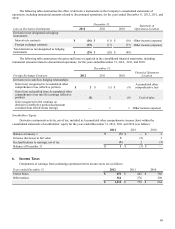
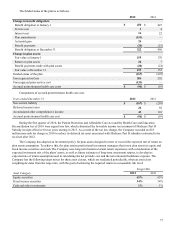
The following tables summarize the fair values and location in the consolidated balance sheets of all derivative financial
instruments held by the Company, at December 31, 2012 and 2011:
Fair Values of Derivative Instruments
Assets Liabilities
December 31, 2012
Fair
Val ue
Balance
Sheet
Location
Fair
Val ue
Balance
Sheet
Location
Derivatives designated as hedging instruments:
Foreign exchange contracts $ 1 Other assets $ — Other liabilities
Derivatives not designated as hedging instruments:
Foreign exchange contracts 2 Other assets 3 Other liabilities
Interest agreement contracts — Other assets 4 Other liabilities
Total derivatives not designated as hedging instruments 27
Total derivatives $3
$7
Fair Values of Derivative Instruments
Assets Liabilities
December 31, 2011
Fair
Val ue
Balance
Sheet
Location
Fair
Val ue
Balance
Sheet
Location
Derivatives designated as hedging instruments:
Foreign exchange contracts $ — Other assets $ 2 Other liabilities
Derivatives not designated as hedging instruments:
Foreign exchange contracts 1 Other assets 3 Other liabilities
Interest agreement contracts — Other assets 3 Other liabilities
Total derivatives not designated as hedging instruments 1 6
Total derivatives $ 1 $8