Mercedes 2013 Annual Report Download - page 26
Download and view the complete annual report
Please find page 26 of the 2013 Mercedes annual report below. You can navigate through the pages in the report by either clicking on the pages listed below, or by using the keyword search tool below to find specific information within the annual report.-
 1
1 -
2
-
3
-
4
-
5
-
6
-
7
-
8
-
9
-
10
-
11
-
12
-
13
-
14
-
15
-
 16
16 -
 17
17 -
 18
18 -
 19
19 -
 20
20 -
 21
21 -
 22
22 -
 23
23 -
 24
24 -
 25
25 -
 26
26 -
 27
27 -
 28
28 -
 29
29 -
 30
30 -
 31
31 -
 32
32 -
 33
33 -
 34
34 -
 35
35 -
 36
36 -
37
-
38
-
39
-
40
-
41
-
42
-
43
-
44
-
45
-
46
-
47
-
48
-
49
-
50
-
51
-
52
-
53
-
54
-
55
-
56
-
57
-
58
-
59
-
60
-
61
-
62
-
63
-
64
-
65
-
66
-
67
-
68
-
69
-
70
-
71
-
72
-
73
-
74
-
75
-
76
-
77
-
78
-
79
-
80
-
81
-
82
-
83
-
84
-
85
-
86
-
87
-
88
-
89
-
90
-
91
-
92
-
93
-
94
-
95
-
96
-
97
-
98
-
99
-
100
-
101
-
102
-
103
-
104
-
105
-
106
-
107
-
108
-
109
-
110
-
111
-
112
-
113
-
114
-
115
-
116
-
117
-
118
-
119
-
120
-
121
-
122
-
123
-
124
-
125
-
126
-
127
-
128
-
129
-
130
-
131
-
132
-
133
-
134
-
135
-
136
-
137
-
138
-
139
-
140
-
141
-
142
-
143
-
144
-
145
-
146
-
147
-
148
-
149
-
150
-
151
-
152
-
153
-
154
-
155
-
156
-
157
-
158
-
159
-
160
-
161
-
162
-
163
-
164
-
165
-
166
-
167
-
168
-
169
-
170
-
171
-
172
-
173
-
174
-
175
-
176
-
177
-
178
-
179
-
180
-
181
-
182
-
183
-
184
-
185
-
186
-
187
-
188
-
189
-
190
-
191
-
192
-
193
-
194
-
195
-
196
-
197
-
198
-
199
-
200
-
201
-
202
-
203
-
204
-
205
-
206
-
207
-
208
-
209
-
210
-
211
-
212
-
213
-
214
-
215
-
216
-
217
-
218
-
219
-
220
-
221
-
222
-
223
-
224
-
225
-
226
-
227
-
228
-
229
-
230
-
231
-
232
-
233
-
234
-
235
-
236
-
237
-
238
-
239
-
240
-
241
-
242
-
243
-
244
-
245
-
246
-
247
-
248
-
249
-
250
-
251
-
252
-
253
-
254
-
255
-
256
-
257
-
258
-
259
-
260
-
261
-
262
-
263
-
264
-
265
-
266
-
267
-
268
-
269
-
270
-
271
-
272
-
273
-
274
-
275
-
276
-
277
-
278
-
279
-
280
-
281
-
282
-
283
-
284
 |
 |

22
A good year on the world’s stock markets. Global stock
markets developed very positively in 2013. At the beginning
of the year, stock markets were buoyed by positive growth
signs in China and by a preliminary agreement for preventing
the United States from falling off a “fiscal cliff.” With major
central banks continuing to pursue an expansionary monetary
policy, investors increasingly allocated the resulting high
market liquidity to purchase equities. As a result, key stock-
market indices rose to all-time highs during the year. However,
the return of uncertainty regarding the sovereign debt crisis
in Europe caused shares to lose some of their gains in the first
quarter and at the beginning of the second quarter. But confi-
dence in the economic development of the European Monetary
Union improved again later in the year. This caused investors’
demand for shares to grow even more – a development that espe-
cially benefited cyclical stocks. In the middle of the year,
statements by the Federal Reserve Bank concerning a possible
tapering of its expansionary monetary policy caused share
prices to fall worldwide. This sell-off was intensified by higher
interest rates in China and by concerns regarding a decrease
in the availability of credit there.
However, stock markets developed very favorably once again
in the third quarter. This was mainly due to the stabilization
of the macroeconomic situation in Europe, the United States
and China, which offset concerns regarding the political
situation in the Middle East. The budget conflict in the US and
the debate about the country’s debt ceiling had only a tem-
porary effect on share prices. In conjunction with positive eco-
nomic indicators, the continued expansionary monetary
policy of key central banks – including the European Central
Bank’s surprise interest rate cut – helped share prices to
increase across the board later in the year. Under these condi-
tions, many stock market indices rose to all-time highs in
the last two months of the year.
The index of the most important shares in the euro zone,
the Dow Jones Euro STOXX 50, rose by 18% in 2013, although
the entire increase occurred in the second half of the year.
Due to the robust condition of the German economy, the lead-
ing German index, the DAX, did even better, rising by 25%.
The DAX reached a new all-time high of 9,589 on December 27.
In the United States, the Dow Jones rose by 27% during the
year, while Japan’s Nikkei index was even 57% higher at the end
of 2013 than at the beginning.
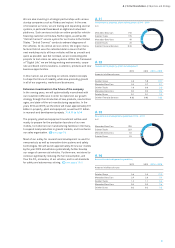
A.01
Daimler and the Capital Market.
Daimler’s share price gains 52% over the year. Global stock markets developed very positively
in 2013, supported by the expansive monetary policy of the central banks and the easing
of the European sovereign debt crisis. The Board of Management and the Supervisory Board
propose an increased dividend of €2.25 per share (prior year: €2.20). We offer investors
and analysts a comprehensive range of investor relations services. Daimler took advantage
of the high level of liquidity on international capital markets to refinance its operations
at attractive terms.
Development of Daimler’s share price and of major indices
End of 2013 End of 2012 13/12
% change
Daimler share price (in euros) 62.90 41.32 +52
DAX 30 9,552 7,612 +25
Dow Jones Euro STOXX 50 3,109 2,636 +18
Dow Jones Industrial Average 16,577 13,104 +27
Nikkei 16,291 10,395 +57
Dow Jones STOXX Auto Index 482 351 +37
A.01
Key figures per share
2013 2012 13/12
Amounts in euros % change
Net profit 6.40 6.02 +6
Net profit (diluted) 6.40 6.02 +6
Dividend 2.25 2.20 +2
Equity (December 31) 39.90 35.51 +12
Xetra price at year end1 62.90 41.32 +52
Highest1 63.15 48.45 +30
Lowest1 38.65 33.40 +16
1 Closing prices
A.02