Marks and Spencer 2011 Annual Report Download - page 12
Download and view the complete annual report
Please find page 12 of the 2011 Marks and Spencer annual report below. You can navigate through the pages in the report by either clicking on the pages listed below, or by using the keyword search tool below to find specific information within the annual report.-
 1
1 -
 2
2 -
 3
3 -
 4
4 -
 5
5 -
 6
6 -
 7
7 -
 8
8 -
 9
9 -
 10
10 -
 11
11 -
 12
12 -
 13
13 -
 14
14 -
 15
15 -
 16
16 -
 17
17 -
 18
18 -
 19
19 -
 20
20 -
 21
21 -
 22
22 -
23
-
24
-
25
-
26
-
27
-
28
-
29
-
30
-
31
-
32
-
33
-
34
-
35
-
36
-
37
-
38
-
39
-
40
-
41
-
42
-
43
-
44
-
45
-
46
-
47
-
48
-
49
-
50
-
51
-
52
-
53
-
54
-
55
-
56
-
57
-
58
-
59
-
60
-
61
-
62
-
63
-
64
-
65
-
66
-
67
-
68
-
69
-
70
-
71
-
72
-
73
-
74
-
75
-
76
-
77
-
78
-
79
-
80
-
81
-
82
-
83
-
84
-
85
-
86
-
87
-
88
-
89
-
90
-
91
-
92
-
93
-
94
-
95
-
96
-
97
-
98
-
99
-
100
-
101
-
102
-
103
-
104
-
105
-
106
-
107
-
108
-
109
-
110
-
111
-
112
-
113
-
114
-
115
-
116
 |
 |

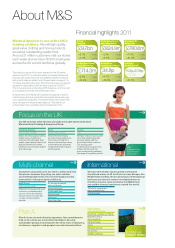
Financial performance
Drive UK space growth
Performance against our plan
Group revenue
bCO +2.1% (53 wks)
+4.2% (52 wks)
-2.3% (53 wks)
+5.9% (52 wks)
Underlying Group operating profit
bN
UK market share clothing and footwear UK market share food
Value
Volume
+0.5%pts +0.3%pts +0.1%pts
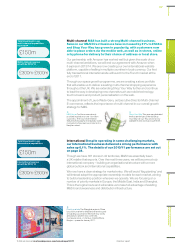
Focusing on the UK
Analysis This year we grew market share across all areas of our clothing
business, as we offered customers greater choice at the same unrivalled
quality and value. More information on our clothing performance is set out
on page 16.
4PVSD F,BOUBS8PSM E QBOF M$MPUIJ OHB OEGPPU XF BSTIB S FXF" QSJ M
Analysis Our food market share increased this year as customers did more
of their shopping with M&S, recognising the great value and quality we offer.
Our performance in this area is detailed on page 20.
4PVSD F,BOUB S8PSM EQBO F M'PPEBO E% SJO LTI BSFXF"QS JM
P16
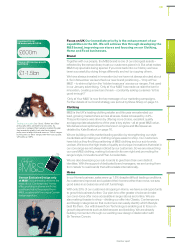
Annual space growth
Analysis This year we have set out a commitment
to deliver c.3% UK space growth per annum
until2015/16. This programme will help us
createa store portfolio that delivers a leading
multi-channel shopping experience.
Average weekly footfall
N -0.3%
Analysis Customer visits to our stores were broadly stable in 2010/11.
Concerns about rising petrol prices meant footfall slowed slightly in the
second half of the year. However, we remained ahead of the overall market
figure of -1.4%.
20.7m
21.0m
21.6m
21.8m
10/11
09/10
08/09
07/08
£824.9m
£843.9m
£768.9m
£1,089.3m
10/11
09/10
08/09
07/08
£m 07/08 08/09 09/10 10/11
UK 8,309.1 8,164.3 8,567.9 8,733.0
International 712.9 897.8 968.7 1,007.3
Total 9,022.0 9,062.1 9,536.6 9,740.3
£m 07/08 08/09 09/10 10/11
UK 972.9 652.8 701.2 677.9
International 116.4 116.1 142.7 147.0
Total 1,089.3 768.9 843.9 824.9
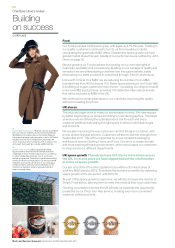
UK mystery shopping programme
Average score is
Analysis In April 2010 we rebased our myster y shopping scores to help us target even
higher standards of customer service. This year we conducted around 6,800 visits to
stores and have seen a steady improvement in performance over the course of the
year, with average scores increasing by 11%.
70
75
80
85
90
Apr May Jun Jul Aug Sep Oct Nov Dec Jan Feb Mar
83
78
79
76
76
74
72
77
79
81 82
79
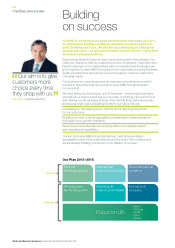
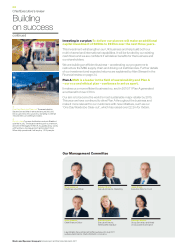
In November 2010 we set out plans to invest an
additional £850m to £900m over the next three
years to enhance our UK business and develop
our multi-channel and international capabilities.
As a result, we have set a target to grow Group
revenue to between £11.5bn and £12.5bn
by2013/14.
Marks and Spencer Group plc Annual report and financial statements 2011
10
0VS
QFSGPSNBODF