Louis Vuitton 2005 Annual Report Download - page 11
Download and view the complete annual report
Please find page 11 of the 2005 Louis Vuitton annual report below. You can navigate through the pages in the report by either clicking on the pages listed below, or by using the keyword search tool below to find specific information within the annual report.-
 1
1 -
 2
2 -
 3
3 -
 4
4 -
 5
5 -
 6
6 -
 7
7 -
 8
8 -
 9
9 -
 10
10 -
 11
11 -
 12
12 -
 13
13 -
 14
14 -
 15
15 -
 16
16 -
 17
17 -
 18
18 -
 19
19 -
 20
20 -
 21
21 -
 22
22 -
23
-
24
-
25
-
26
-
27
-
28
-
29
-
30
-
31
-
32
-
33
-
34
-
35
-
36
-
37
-
38
-
39
-
40
-
41
-
42
-
43
-
44
-
45
-
46
-
47
-
48
-
49
-
50
-
51
-
52
-
53
-
54
-
55
-
56
-
57
-
58
-
59
-
60
-
61
-
62
-
63
-
64
-
65
-
66
-
67
-
68
-
69
-
70
-
71
-
72
-
73
-
74
-
75
-
76
-
77
-
78
-
79
-
80
 |
 |

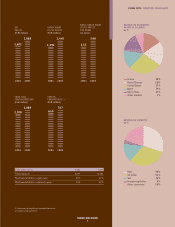
LVMH 2005 FINANCIAL HIGHLIGHTS
PASSIONATE ABOUT CREATIVITY
9
NET
PROFIT
(EUR million)
2004
1,402
2005
1,668
GROUP SHARE
OF NET PROFIT
(EUR million)
2004
1,194
2005
1,440
CASH FLOW
FROM OPERATIONS
(EUR million)
2004
2,708
2005
3,089
CAPITAL
EXPENDITURES (1)
(EUR million)
2004
640
2005
707
BASIC GROUP SHARE
OF NET PROFIT
PER SHARE
(in euros)
2004
2.55
2005
3.06
(EUR million and %) 2004 2005
Total equity (2) 8,675 10,484
Net financial debt to equity ratio 61% 41%
Net financial debt to adjusted equity 55% 41%
(1) Acquisitions of tangible and intangible fixed assets.
(2) Includes minority interests.
REVENUE BY GEOGRAPHIC
REGION OF DELIVERY
in %
France 15%
Rest of Europe 20%
United States 27%
Japan 14%
Rest of Asia 17%
Other markets 7%
REVENUE BY CURRENCY
in %
Euro 30%
US Dollar 32%
Yen 15%
Hong Kong Dollar 3%
Other currencies 20%