LG 2012 Annual Report Download - page 53
Download and view the complete annual report
Please find page 53 of the 2012 LG annual report below. You can navigate through the pages in the report by either clicking on the pages listed below, or by using the keyword search tool below to find specific information within the annual report.-
 1
1 -
2
-
3
-
4
-
5
-
6
-
7
-
8
-
9
-
10
-
11
-
12
-
13
-
14
-
15
-
16
-
17
-
18
-
19
-
20
-
21
-
22
-
23
-
24
-
25
-
26
-
27
-
28
-
29
-
30
-
31
-
32
-
33
-
34
-
35
-
36
-
37
-
38
-
39
-
40
-
41
-
42
-
 43
43 -
 44
44 -
 45
45 -
 46
46 -
 47
47 -
 48
48 -
 49
49 -
 50
50 -
 51
51 -
 52
52 -
 53
53 -
 54
54
 |
 |
88 89
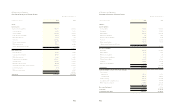
Years ended December 31, 2012 and 2011 Years ended December 31, 2012 and 2011
Attributable to equity holders of the Parent Company
(in millions of Korean won) Paid-in
Capital
Retained
Earnings
Accumulated
Other
Comprehensive
Income(loss)
Other
Components
of Equity
Total
Non-
controlling
Interest
Total
Equity
Balance at January 1, 2011 3,017,088 10,108,173 (209,844) (271,277) 12,644,140 215,497 12,859,637
Comprehensive income:
Profit(loss) for the year - (469,624) - - (469,624) 36,819 (432,805)
Actuarial loss on defined benefit
liability - (94,056) - - (94,056) - (94,056)
Share of actuarial loss of associates - (11,887) - - (11,887) - (11,887)
Other comprehensive income of
associates and joint ventures - - 22,259 - 22,259 - 22,259
Cash flow hedges - - (4,717) - (4,717) - (4,717)
Available-for-sale financial assets - - (3,474) - (3,474) - (3,474)
Currency translation differences - - (130,808) - (130,808) 13,175 (117,633)
Total comprehensive income(loss) - (575,567) (116,740) - (692,307) 49,994 (642,313)
Transactions with equity holders of
the Parent Company :
Dividends - (33,072) - - (33,072) (11,381) (44,453)
Paid-in Capital 975,260 - - - 975,260 - 975,260
Change in ownership interest over
subsidiaries - - - (62) (62) 179 117
Total transactions with equity holders of
the Parent Company 975,260 (33,072) - (62) 942,126 (11,202) 930,924
Balance at December 31, 2011 3,992,348 9,499,534 (326,584) (271,339) 12,893,959 254,289 13,148,248
Balance at January 1, 2012 3,992,348 9,499,534 (326,584) (271,339) 12,893,959 254,289 13,148,248
Comprehensive income:
Profit for the year - 66,774 - - 66,774 24,047 90,821
Actuarial loss on defined benefit
liability - (90,741) - - (90,741) (56) (90,797)
Share of actuarial loss of associates - (31,018) - - (31,018) - (31,018)
Other comprehensive income of
associates and joint ventures - - (50,790) - (50,790) - (50,790)
Cash flow hedges - - 4,184 - 4,184 - 4,184
Available-for-sale financial assets - - (671) - (671) 70 (601)
Currency translation differences - - (300,360) - (300,360) (15,386) (315,746)
Total comprehensive income(loss) - (54,985) (347,637) - (402,622) 8,675 (393,947)
Transactions with equity holders of
the Parent Company:
Dividends - (36,872) - - (36,872) (21,961) (58,833)
Issuance of new shares of subsidiaries - - - - - 8,820 8,820
Others - (10) - (43) (53) (18) (71)
Total transactions with equity holders of
the Parent Company - (36,882) - (43) (36,925) (13,159) (50,084)
Balance at December 31, 2012 3,992,348 9,407,667 (674,221) (271,382) 12,454,412 249,805 12,704,217
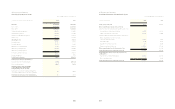
(in millions of Korean won) 2012 2011
Cash flows from operating activities
Cash generated from operations 2,459,395 2,240,468
Interest received 71,491 74,412
Interest paid (322,383) (310,460)
Dividends received 36,640 84,859
Income tax paid (493,705) (359,212)
Net cash generated from operating activities 1,751,438 1,730,067
Cash flows from investing activities
Decrease in financial deposits 116,697 -
Decrease in loans and other receivables 206,853 148,705
Proceeds from disposal of other financial assets 49,300 38,303
Proceeds from disposal of property, plant and equipment 74,556 77,780
Proceeds from disposal of intangible assets 2,977 15,954
Proceeds from disposal of and recovery of investments in associates
and joint ventures 216,412 866
Decrease in other assets 1,033 4,155
Increase in financial deposits - (77,352)
Increase in loans and other receivables (191,542) (212,227)
Acquisition of other financial assets (52,553) (91,989)
Acquisition of property, plant and equipment (1,404,107) (1,830,008)
Acquisition of intangible assets (343,050) (319,850)
Acquisition of investments in associates and joint ventures (26,098) (998)
Decrease in cash and cash equivalents due to changes in scope of
subsidiaries - (205,254)
Increase in other assets (188) -
Net cash used in investing activities (1,349,710) (2,451,915)
Cash flows from financing activities
Proceeds from borrowings 1,912,079 3,020,490
Issuance of ordinary shares 8,820 975,461
Repayments of borrowings (2,718,206) (2,792,295)
Dividends paid (59,065) (43,143)
Net cash (used in)provided by financing activities (856,372) 1,160,513
Exchange losses on cash and cash equivalents (58,631) (37,362)
Net (decrease)increase in cash and cash equivalents (513,275) 401,303
Cash and cash equivalents at the beginning of year 2,345,465 1,944,162
Cash and cash equivalents at the end of year 1,832,190 2,345,465
LG Electronics and Subsidiaries
Consolidated Statements of Changes in Equity
LG Electronics and Subsidiaries
Consolidated Statements of Cash Flows