LG 2012 Annual Report Download - page 51
Download and view the complete annual report
Please find page 51 of the 2012 LG annual report below. You can navigate through the pages in the report by either clicking on the pages listed below, or by using the keyword search tool below to find specific information within the annual report.-
 1
1 -
2
-
3
-
4
-
5
-
6
-
7
-
8
-
9
-
10
-
11
-
12
-
13
-
14
-
15
-
16
-
17
-
18
-
19
-
20
-
21
-
22
-
23
-
24
-
25
-
26
-
27
-
28
-
29
-
30
-
31
-
32
-
33
-
34
-
35
-
36
-
37
-
38
-
39
-
40
-
 41
41 -
 42
42 -
 43
43 -
 44
44 -
 45
45 -
 46
46 -
 47
47 -
 48
48 -
 49
49 -
 50
50 -
 51
51 -
 52
52 -
 53
53 -
 54
54
 |
 |

84 85
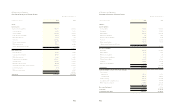
LG Electronics and Subsidiaries
Consolidated Statements of Financial Position
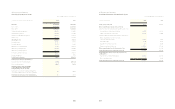
LG Electronics and Subsidiaries
Consolidated Statements of Financial Position
(in millions of Korean won) 2012 2011
Assets
Current assets
Cash and cash equivalents 1,832,190 2,345,465
Financial deposits 54,000 150,000
Trade receivables 6,519,157 6,752,559
Loans and other receivables 474,672 494,239
Other financial assets 54,109 1,677
Inventories 4,599,422 4,947,160
Current income tax assets 223,513 197,968
Other current assets 777,246 890,388
Assets classified as held for sale 19,980 3,670
14,554,289 15,783,126
Non-current assets
Financial deposits 103,176 129,439
Loans and other receivables 587,359 610,709
Other financial assets 63,086 139,282
Property, plant and equipment 7,517,611 7,290,413
Intangible assets 1,077,440 1,035,797
Deferred income tax assets 1,289,278 1,246,071
Investments in associates and joint ventures 5,477,070 5,603,199
Investment property 7,218 7,239
Other non-current assets 780,859 813,182
16,903,097 16,875,331
Total assets 31,457,386 32,658,457
(in millions of Korean Won) 2012 2011
Liabilities
Current liabilities
Trade payables 5,194,830 5,486,871
Borrowings 2,044,991 3,178,212
Other payables 4,023,964 3,780,158
Other financial liabilities 321 13,860
Current income tax liabilities 105,988 81,643
Provisions 639,091 724,516
Other current liabilities 804,933 949,262
Liabilities related to assets held for sale 1,794 -
12,815,912 14,214,522
Non-current liabilities
Borrowings 4,425,663 4,257,406
Other payables 19,114 20,490
Other financial liabilities 16,621 378
Deferred income tax liabilities 10,330 15,237
Defined benefit liability 529,359 423,306
Provisions 932,871 575,632
Other non-current liabilities 3,299 3,238
5,937,257 5,295,687
Total liabilities 18,753,169 19,510,209
Equity attributable to owners of the Parent Company
Paid-in capital:
Capital stock 904,169 904,169
Share premium 3,088,179 3,088,179
Retained earnings 9,407,667 9,499,534
Accumulated other comprehensive loss (674,221) (326,584)
Other components of equity (271,382) (271,339)
12,454,412 12,893,959
Non-controlling interest 249,805 254,289
Total equity 12,704,217 13,148,248
Total liabilities and equity 31,457,386 32,658,457
December 31, 2012 and 2011 December 31, 2012 and 2011