LG 2012 Annual Report Download - page 52
Download and view the complete annual report
Please find page 52 of the 2012 LG annual report below. You can navigate through the pages in the report by either clicking on the pages listed below, or by using the keyword search tool below to find specific information within the annual report.
86 87
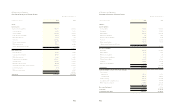
(in millions of Korean won, except per share amounts) 2012 2011
Net sales 50,959,978 54,256,585
Cost of sales 38,652,915 42,057,595
Gross profit 12,307,063 12,198,990
Selling and marketing expenses 6,785,477 7,158,784
Administrative expenses 1,229,288 1,366,823
Research and development expenses 1,831,211 1,698,917
Service costs 1,325,106 1,595,453
Operating income 1,135,981 379,013
Financial income 441,380 571,693
Financial expenses 735,719 909,804
Gain (loss) from equity method 46,189 (329,472)
Other non-operating income 1,256,378 1,582,432
Other non-operating expenses 1,620,142 1,693,175
Profit (loss) before income tax 524,067 (399,313)
Income tax expense 433,246 33,492
Profit (loss) for the year 90,821 (432,805)
Profit (loss) for the year attributable to:
Equity holders of the Parent Company 66,774 (469,624)
Non-controlling interest 24,047 36,819
Earnings (loss) per share attributable
to the equity holders of the Parent
Company during the year (in won):
Earnings (loss) per share for profit attributable to
the ordinary equity holders of the Parent Company 366 (2,880)
Earnings (loss) per share for profit attributable to
the preferred equity holders of the Parent Company 416 (2,563)
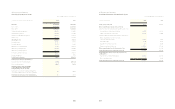
(in millions of Korean won) 2012 2011
Profit (loss) for the year 90,821 (432,805)
Other comprehensive income (loss), net of tax
Items that will not be reclassified subsequently to profit or loss:
Actuarial loss on defined benefit liability (90,797) (94,056)
Share of actuarial loss of associates (31,018) (11,887)
Items that will be reclassified subsequently to profit or loss:
Other comprehensive income (loss) from
associates and joint ventures (50,790) 22,259
Cash flow hedges 4,184 (4,717)
Available-for-sale financial assets (601) (3,474)
Currency translation differences (315,746) (117,633)
Other comprehensive loss for the year, net of tax (484,768) (209,508)
Total comprehensive loss for the year, net of tax (393,947) (642,313)
Comprehensive income (loss) for the year, net of tax,
attributable to:
Equity holders of the Parent Company (402,622) (692,307)
Non-controlling interest 8,675 49,994
Total comprehensive loss for the year, net of tax (393,947) (642,313)
Years ended December 31, 2012 and 2011 Years ended December 31, 2012 and 2011
LG Electronics and Subsidiaries
Consolidated Statements of Income
LG Electronics and Subsidiaries
Consolidated Statements of Comprehensive Income


