Kroger 2008 Annual Report Download - page 4
Download and view the complete annual report
Please find page 4 of the 2008 Kroger annual report below. You can navigate through the pages in the report by either clicking on the pages listed below, or by using the keyword search tool below to find specific information within the annual report.-
 1
1 -
 2
2 -
 3
3 -
 4
4 -
 5
5 -
 6
6 -
 7
7 -
 8
8 -
 9
9 -
 10
10 -
 11
11 -
 12
12 -
 13
13 -
 14
14 -
 15
15 -
16
-
17
-
18
-
19
-
20
-
21
-
22
-
23
-
24
-
25
-
26
-
27
-
28
-
29
-
30
-
31
-
32
-
33
-
34
-
35
-
36
-
37
-
38
-
39
-
40
-
41
-
42
-
43
-
44
-
45
-
46
-
47
-
48
-
49
-
50
-
51
-
52
-
53
-
54
 |
 |
The Kroger Co. Page 3
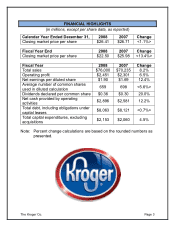
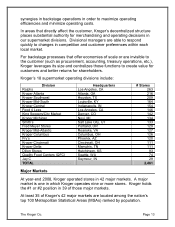
FINANCIAL HIGHLIGHTS
(in millions, except per share data, as reported)
Calendar Year Ended December 31,
2008
2007
Change
Closing market price per share
$26.41
$26.71
<1.1%>
Fiscal Year End
2008
2007
Change
Closing market price per share
$22.50
$25.98
<13.4%>
Fiscal Year
2008
2007
Change
Total sales
$76,000
$70,235
8.2%
Operating profit
$2,451
$2,301
6.5%
Net earnings per diluted share
$1.90
$1.69
12.4%
Average number of common shares
used in diluted calculation
659
698
<5.6%>
Dividends declared per common share
$0.36
$0.30
20.0%
Net cash provided by operating
activities
$2,896
$2,581
12.2%
Total debt, including obligations under
capital leases
$8,063
$8,121
<0.7%>
Total capital expenditures, excluding
acquisitions
$2,153
$2,060
4.5%
Note: Percent change calculations are based on the rounded numbers as
presented.