Kroger 2008 Annual Report Download - page 18
Download and view the complete annual report
Please find page 18 of the 2008 Kroger annual report below. You can navigate through the pages in the report by either clicking on the pages listed below, or by using the keyword search tool below to find specific information within the annual report.-
 1
1 -
2
-
3
-
4
-
5
-
6
-
7
-
 8
8 -
 9
9 -
 10
10 -
 11
11 -
 12
12 -
 13
13 -
 14
14 -
 15
15 -
 16
16 -
 17
17 -
 18
18 -
 19
19 -
 20
20 -
 21
21 -
 22
22 -
 23
23 -
 24
24 -
 25
25 -
 26
26 -
 27
27 -
 28
28 -
29
-
30
-
31
-
32
-
33
-
34
-
35
-
36
-
37
-
38
-
39
-
40
-
41
-
42
-
43
-
44
-
45
-
46
-
47
-
48
-
49
-
50
-
51
-
52
-
53
-
54
 |
 |

The Kroger Co. Page 17
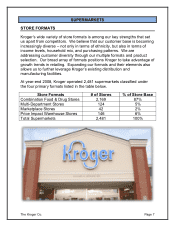
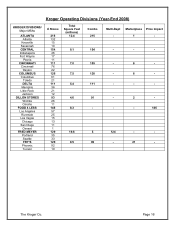
Kroger Operating Divisions (Year-End 2008)
KROGER DIVISIONS/
Major MSAs
# Stores
Total
Square Feet
(millions)
Combo
Multi-Dept
Marketplace
Price Impact
JAY C
29
0.8
29
-
-
-
Louisville
6
KING SOOPERS
142
8.2
142
-
-
-
Denver
73
Colorado Springs
11
MICHIGAN
134
7.0
134
-
-
-
Detroit
90
Flint
13
MID-ATLANTIC
127
6.3
127
-
-
-
Richmond
16
Roanoke
14
Charleston WV
12
Raleigh
11
MID-SOUTH
164
8.7
164
-
-
-
Nashville
48
Louisville
39
Lexington
19
QFC
74
2.6
74
-
-
-
Seattle
61
Portland
6
RALPHS
263
11.2
263
-
-
-
Los Angeles
185
Riverside
32
San Diego
27
Oxnard
11
SMITH’S
133
8.5
127
-
6
-
Las Vegas
31
Salt Lake City
24
Albuquerque
17
Ogden
9
SOUTHWEST
209
11.9
209
-
-
-
Houston
102
Dallas
53
Fort Worth
27
TOTAL
2,481
146.5
2,169
124
42
146