Kroger 2008 Annual Report Download - page 32
Download and view the complete annual report
Please find page 32 of the 2008 Kroger annual report below. You can navigate through the pages in the report by either clicking on the pages listed below, or by using the keyword search tool below to find specific information within the annual report.-
 1
1 -
2
-
3
-
4
-
5
-
6
-
7
-
8
-
9
-
10
-
11
-
12
-
13
-
14
-
15
-
16
-
17
-
18
-
19
-
20
-
21
-
 22
22 -
 23
23 -
 24
24 -
 25
25 -
 26
26 -
 27
27 -
 28
28 -
 29
29 -
 30
30 -
 31
31 -
 32
32 -
 33
33 -
 34
34 -
 35
35 -
 36
36 -
 37
37 -
 38
38 -
 39
39 -
 40
40 -
 41
41 -
 42
42 -
43
-
44
-
45
-
46
-
47
-
48
-
49
-
50
-
51
-
52
-
53
-
54
 |
 |

The Kroger Co. Page 31
RETAIL FUEL OPERATIONS
Kroger believes that gasoline is a natural addition to our “one-stop”
shopping strategy because it offers our customers tremendous
convenience and value. Fuel centers also allow Kroger to build on our
decades of experience in selling gasoline at our convenience stores.
Despite low margins, fuel centers can deliver a high return on investment
because of their extraordinary inventory turns and positive effect on overall
store sales.
The typical supermarket fuel center consists of three to seven multi-product
dispensers covered by a well-lit canopy, and an 8’ x 12’ kiosk from which
cigarettes, soft drinks, snacks, candy and miscellaneous automotive-
related products are sold.
At year-end 2008, Kroger’s retail fuel operations included 781 supermarket
fuel centers in 30 states and 699 convenience stores that sell fuel. (We
operate 771 convenience stores in total. See the “Convenience Stores”
section on Page 19 of this Fact Book.)
Financial Impact
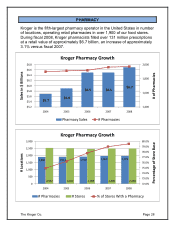
Sales
Fuel sales affect certain financial indicators. They comprise a portion of the
Company’s total food store sales results.
$57.7
$60.1
$63.8
$4.5
$5.7
$7.5
$45.0
$50.0
$55.0
$60.0
$65.0
$70.0
$75.0
FY 2006
FY 2007
FY 2008
Billions
Total Food Store Fuel Sales
Total Food Store Sales Without Fuel