JetBlue Airlines 2014 Annual Report Download - page 50
Download and view the complete annual report
Please find page 50 of the 2014 JetBlue Airlines annual report below. You can navigate through the pages in the report by either clicking on the pages listed below, or by using the keyword search tool below to find specific information within the annual report.-
 1
1 -
2
-
3
-
4
-
5
-
6
-
7
-
8
-
9
-
10
-
11
-
12
-
13
-
14
-
15
-
16
-
17
-
18
-
19
-
20
-
21
-
22
-
23
-
24
-
25
-
26
-
27
-
28
-
29
-
30
-
31
-
32
-
33
-
34
-
35
-
36
-
37
-
38
-
39
-
 40
40 -
 41
41 -
 42
42 -
 43
43 -
 44
44 -
 45
45 -
 46
46 -
 47
47 -
 48
48 -
 49
49 -
 50
50 -
 51
51 -
 52
52 -
 53
53 -
 54
54 -
 55
55 -
 56
56 -
 57
57 -
 58
58 -
 59
59 -
 60
60 -
61
-
62
-
63
-
64
-
65
-
66
-
67
-
68
-
69
-
70
-
71
-
72
-
73
-
74
-
75
-
76
-
77
-
78
-
79
-
80
-
81
-
82
-
83
-
84
-
85
-
86
-
87
-
88
-
89
-
90
-
91
-
92
-
93
-
94
-
95
-
96
 |
 |

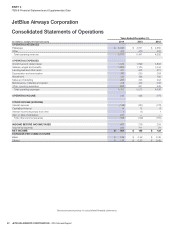
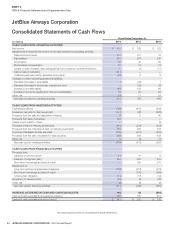
JETBLUE AIRWAYS CORPORATION-2014Annual Report44
PART II
ITEM 8Financial Statements and Supplementary Data
JetBlue Airways Corporation
Consolidated Statements of Cash Flows
(in millions)
Years Ended December 31,
2014 2013 2012
CASH FLOWS FROM OPERATING ACTIVITIES
Net income $ 401 $ 168 $ 128
Adjustments to reconcile net income to net cash provided by operating activities:
Deferred income taxes 212 107 76
Depreciation 263 258 230
Amortization 62 48 39
Stock-based compensation 20 14 13
Losses on sale of assets, debt extinguishment and customer contract termination — (1) (17)
Gain on sale of subsidiary (241) — —
Collateral (paid) returned for derivative instruments (49) 8 8
Changes in certain operating assets and liabilities:
Decrease (Increase) in receivables 1 (22) 1
Decrease (Increase) in inventories, prepaid and other 3 (23) 38
Increase in air traffic liability 148 132 66
Increase in accounts payable and other accrued liabilities 68 52 92
Other, net 24 17 24
Net cash provided by operating activities 912 758 698
CASH FLOWS FROM INVESTING ACTIVITIES
Capital expenditures (730) (615) (542)
Predelivery deposits for flight equipment (127) (22) (283)
Proceeds from the sale and disposition of assets 8 8 46
Proceeds from sale of subsidiary 393 — —
Assets constructed for others — — (2)
Purchase of held-to-maturity investments (361) (234) (444)
Proceeds from the maturities of held-to-maturity investments 379 300 434
Purchase of available-for-sale securities (335) (413) (532)
Proceeds from the sale of available-for-sale securities 398 508 438
Other, net (4) (8) 18
Net cash used in investing activities (379) (476) (867)
CASH FLOWS FROM FINANCING ACTIVITIES
Proceeds from:
Issuance of common stock 41 10 9
Issuance of long-term debt 342 393 215
Short-term borrowings and lines of credit — 190 375
Repayment of:
Long-term debt and capital lease obligations (702) (612) (418)
Short-term borrowings and lines of credit — (190) (463)
Construction obligation (14) (13) (12)
Acquisition of treasury stock (82) (8) (26)
Other, net (2) (9) (2)
Net cash used in financing activities (417) (239) (322)
INCREASE (DECREASE) IN CASH AND CASH EQUIVALENTS 116 43 (491)
Cash and cash equivalents at beginning of period 225 182 673
Cash and cash equivalents at end of period $ 341 $ 225 $ 182
See accompanying notes to consolidated financial statements.