JetBlue Airlines 2014 Annual Report Download - page 35
Download and view the complete annual report
Please find page 35 of the 2014 JetBlue Airlines annual report below. You can navigate through the pages in the report by either clicking on the pages listed below, or by using the keyword search tool below to find specific information within the annual report.-
 1
1 -
2
-
3
-
4
-
5
-
6
-
7
-
8
-
9
-
10
-
11
-
12
-
13
-
14
-
15
-
16
-
17
-
18
-
19
-
20
-
21
-
22
-
23
-
24
-
 25
25 -
 26
26 -
 27
27 -
 28
28 -
 29
29 -
 30
30 -
 31
31 -
 32
32 -
 33
33 -
 34
34 -
 35
35 -
 36
36 -
 37
37 -
 38
38 -
 39
39 -
 40
40 -
 41
41 -
 42
42 -
 43
43 -
 44
44 -
 45
45 -
46
-
47
-
48
-
49
-
50
-
51
-
52
-
53
-
54
-
55
-
56
-
57
-
58
-
59
-
60
-
61
-
62
-
63
-
64
-
65
-
66
-
67
-
68
-
69
-
70
-
71
-
72
-
73
-
74
-
75
-
76
-
77
-
78
-
79
-
80
-
81
-
82
-
83
-
84
-
85
-
86
-
87
-
88
-
89
-
90
-
91
-
92
-
93
-
94
-
95
-
96
 |
 |

JETBLUE AIRWAYS CORPORATION-2014Annual Report 29
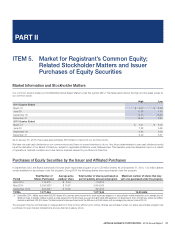
PART II
ITEM7Management’s Discussion and Analysis of Financial Condition and Results of Operations
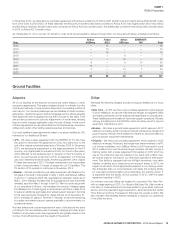
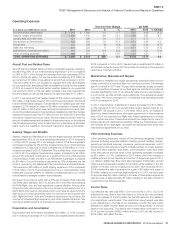
Aircraft Fuel and Related Taxes
Aircraft fuel and related taxes remained our largest expense category,
representing 38% of our total operating expenses in 2013 compared
to 39% in 2012. Even though the average fuel price decreased 2% in
2013 to $3.14 per gallon, our fuel expenses increased by $93 million as
we consumed 41 million more gallons of aircraft fuel compared to 2012,
mainly due to our increased capacity.
In 2013, we recorded $10 million in fuel hedge losses compared to 2012
when we recorded $10 million in effective fuel hedge gains. Fuel derivatives
not qualifying as cash flow hedges in 2013 resulted in losses of less than
$1 million compared to $3 million in losses in 2012 which were recorded
in interest income and other. Accounting ineffectiveness on fuel derivatives
classified as cash flow hedges resulted in losses of less than $1 million
in 2013 and 2012 and were recorded in interest income and other. We
are unable to predict what the amount of ineffectiveness will be related
to these instruments, or the potential loss of hedge accounting which is
determined on a derivative-by-derivative basis, due to the volatility in the
forward markets for these commodities.
Salaries, Wages and Benefits
Salaries, Wages and Benefits were our second largest expense, representing
approximately 23% of our total operating expenses in 2013 and 2012.
During 2013, the average number of full-time equivalent employees
increased by 5% and the average tenure of our Crewmembers increased
to 6.1 years, both of which contributed to a $91 million, or 9%, increase
compared to 2012. Retirement Plus contributions, which equate to 5%
of all of our eligible Crewmembers wages, increased by $4 million and
our 3% retirement contribution for a certain portion of our FAA-licensed
Crewmembers, which we refer to as Retirement Advantage, increased
by $6 million. Our increased profitability resulted in $12 million of profit
sharing expense in 2013 compared to $3 million in 2012.
Maintenance, Materials and Repairs
Maintenance, materials and repairs are generally expensed when incurred,
unless covered by a long-term flight hour services contract. The average
age of our aircraft in 2013 was 7.1 years and we had an average of 11.3
additional operating aircraft in 2013 compared to 2012.
In 2013, maintenance materials and repairs increased by $94 million as
we had higher engine related costs for our EMBRAER 190 aircraft. In
the latter half of 2013, we finalized a flight-hour based maintenance and
repair agreement for these engines, which is expected to result in better
planning of maintenance activities.
Other Operating Expenses
Other operating expenses increased by $52 million, or 9%, compared to
2012 due to an increase in outside services. As our capacity and number of
departures grew in 2013, our related variable handling costs also increased.
Additionally we had higher information technology related costs due to
increases in volume and usage. Non-recurring items in 2013 included a
gain of approximately $2 million relating to the sale of three spare aircraft
engines as well as a gain of approximately $7 million relating to the sale
of LiveTV’s investment in the Airfone business. In 2012 we sold six spare
engines and two EMBRAER 190 aircraft resulting in gains of approximately
$10 million as well as the termination of a customer by LiveTV resulting in
a gain of approximately $8 million.
Income Taxes
Our effective tax rate was 40% in 2013 and 39% in 2012. Our effective
tax rate differs from the statutory income tax rate primarily due to state
income taxes and the non-deductibility of certain items for tax purposes.
It is also affected by the relative size of these items to our 2013 pre-tax
income of $279 million and our 2012 pre-tax income of $209 million.
Non-GAAP Financial Measures
We sometimes use non-GAAP measures that are derived from the
consolidated financial statements, but that are not presented in accordance
with generally accepted accounting principles in the U.S., or U.S. GAAP. We
believe these non-GAAP measures provide a meaningful comparison of our
results to others in the airline industry and our prior year results. Investors
should consider these non-GAAP financial measures in addition to, and
not as a substitute for, our financial performance measures prepared in
accordance with U.S. GAAP. Further, our non-GAAP information may be
different from the non-GAAP information provided by other companies.
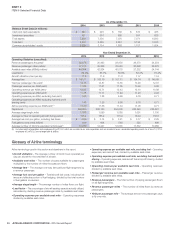
Costs per Available Seat Mile (Non-GAAP)
Costs per available seat mile, or CASM, is a common metric used in the
airline industry. Our CASM for 2014 and 2013 are summarized in the table
below. We exclude aircraft fuel and related taxes and profit sharing from
operating cost per available seat mile to determine CASM ex-fuel and profit
sharing. We believe that CASM ex-fuel and profit sharing provides investors
the ability to measure financial performance excluding items beyond our
control, such as (i) fuel costs, which are subject to many economic and
political factors beyond our control, and (ii) profit sharing, which is sensitive
to volatility in earnings. We believe this measure is more indicative of our
ability to manage costs and is more comparable to measures reported
by other major airlines. We are unable to reconcile such projected CASM
ex-fuel and profit sharing as the nature or amount of excluded items are
only estimated at this time.
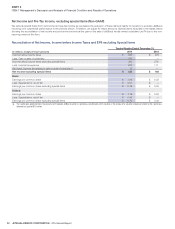
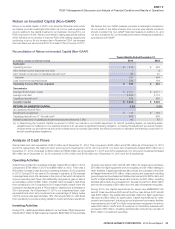
Reconciliation of Operating expense per ASM, excluding fuel and profit sharing
(in millions, per ASM data in cents)
2014 2013
Per ASM
Year-over-Year Change
$ per ASM $ per ASM %
Total operating expenses $ 5,302 11.78 $ 5,013 11.71 0.6
Less: Aircraft fuel and related taxes 1,912 4.25 1,899 4.43 (4.1)
Operating expenses, excluding fuel 3,390 7.53 3,114 7.28 3.5
Less: Profit sharing 25 0.05 12 0.03 66.6
OPERATING EXPENSE, EXCLUDING FUEL
& PROFIT SHARING $ 3,365 7.48 $ 3,102 7.25 3.2