JetBlue Airlines 2014 Annual Report Download - page 34
Download and view the complete annual report
Please find page 34 of the 2014 JetBlue Airlines annual report below. You can navigate through the pages in the report by either clicking on the pages listed below, or by using the keyword search tool below to find specific information within the annual report.-
 1
1 -
2
-
3
-
4
-
5
-
6
-
7
-
8
-
9
-
10
-
11
-
12
-
13
-
14
-
15
-
16
-
17
-
18
-
19
-
20
-
21
-
22
-
23
-
 24
24 -
 25
25 -
 26
26 -
 27
27 -
 28
28 -
 29
29 -
 30
30 -
 31
31 -
 32
32 -
 33
33 -
 34
34 -
 35
35 -
 36
36 -
 37
37 -
 38
38 -
 39
39 -
 40
40 -
 41
41 -
 42
42 -
 43
43 -
 44
44 -
45
-
46
-
47
-
48
-
49
-
50
-
51
-
52
-
53
-
54
-
55
-
56
-
57
-
58
-
59
-
60
-
61
-
62
-
63
-
64
-
65
-
66
-
67
-
68
-
69
-
70
-
71
-
72
-
73
-
74
-
75
-
76
-
77
-
78
-
79
-
80
-
81
-
82
-
83
-
84
-
85
-
86
-
87
-
88
-
89
-
90
-
91
-
92
-
93
-
94
-
95
-
96
 |
 |

JETBLUE AIRWAYS CORPORATION-2014Annual Report28
PART II
ITEM7Management’s Discussion and Analysis of Financial Condition and Results of Operations
Year 2013 compared to Year 2012
Overview
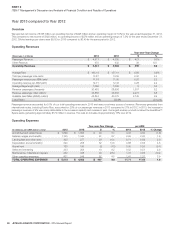
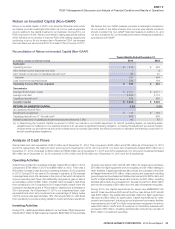
We reported net income of $168 million, an operating income of $428 million and an operating margin of 7.9% for the year ended December 31, 2013.
This compares to net income of $128 million, an operating income of $376 million and an operating margin of 7.5% for the year ended December 31,
2012. Diluted earnings per share were $0.52 for 2013 compared to $0.40 for the same period in 2012.
Operating Revenues
(Revenues in millions)
2013 2012
Year-over-Year Change
$%
Passenger Revenue $ 4,971 $ 4,550 $ 421 9.3%
Other Revenue 470 432 38 8.8
Operating Revenues $ 5,441 $ 4,982 $ 459 9.2
Average Fare $ 163.19 $ 157.11 $ 6.08 3.9%
Yield per passenger mile
(cents)
13.87 13.55 0.32 2.4
Passenger revenue per ASM
(cents)
11.61 11.35 0.26 2.3
Operating revenue per ASM
(cents)
12.71 12.43 0.28 2.2
Average stage length
(miles)
1,090 1,085 5 0.5
Revenue passengers
(thousands)
30,463 28,956 1,507 5.2
Revenue passenger miles
(millions)
35,836 33,563 2,273 6.8
Available Seat Miles (ASMs)
(millions)
42,824 40,075 2,749 6.9
Load Factor 83.7% 83.8% (0.1) pts
Passenger revenue accounted for 91% of our total operating revenues in 2013 and was our primary source of revenue. Revenues generated from
international routes, including Puerto Rico, accounted for 28% of our passenger revenues in 2013 compared to 27% in 2012. In 2013, the increase in
passenger revenues of 9% was mainly attributable to the increased capacity and increase in yield. Our largest ancillary product remained the EvenMore™
Space seats, generating approximately $170 million in revenue. This was an increase of approximately 13% over 2012.
Operating Expenses
(in millions; per ASM data in cents)
2013 2012
Year-over-Year Change per ASM
$%2013 2012 % Change
Aircraft fuel and related taxes $ 1,899 $ 1,806 $ 93 5.1 4.43 4.50 (1.6)
Salaries, wages and benefits 1,135 1,044 91 8.7 2.65 2.60 1.9
Landing fees and other rents 305 277 28 10.1 0.71 0.69 2.9
Depreciation and amortization 290 258 32 12.5 0.68 0.65 4.6
Aircraft rent 128 130 (2) (1.5) 0.30 0.33 (9.1)
Sales and marketing 223 204 19 9.2 0.52 0.51 2.0
Maintenance, materials and repairs 432 338 94 28.0 1.01 0.84 20.2
Other operating expenses 601 549 52 9.5 1.41 1.37 2.9
TOTAL OPERATING EXPENSES $ 5,013 $ 4,606 $ 407 8.8 11.71 11.49 1.9