JetBlue Airlines 2014 Annual Report Download - page 14
Download and view the complete annual report
Please find page 14 of the 2014 JetBlue Airlines annual report below. You can navigate through the pages in the report by either clicking on the pages listed below, or by using the keyword search tool below to find specific information within the annual report.-
 1
1 -
2
-
3
-
 4
4 -
 5
5 -
 6
6 -
 7
7 -
 8
8 -
 9
9 -
 10
10 -
 11
11 -
 12
12 -
 13
13 -
 14
14 -
 15
15 -
 16
16 -
 17
17 -
 18
18 -
 19
19 -
 20
20 -
 21
21 -
 22
22 -
 23
23 -
 24
24 -
25
-
26
-
27
-
28
-
29
-
30
-
31
-
32
-
33
-
34
-
35
-
36
-
37
-
38
-
39
-
40
-
41
-
42
-
43
-
44
-
45
-
46
-
47
-
48
-
49
-
50
-
51
-
52
-
53
-
54
-
55
-
56
-
57
-
58
-
59
-
60
-
61
-
62
-
63
-
64
-
65
-
66
-
67
-
68
-
69
-
70
-
71
-
72
-
73
-
74
-
75
-
76
-
77
-
78
-
79
-
80
-
81
-
82
-
83
-
84
-
85
-
86
-
87
-
88
-
89
-
90
-
91
-
92
-
93
-
94
-
95
-
96
 |
 |

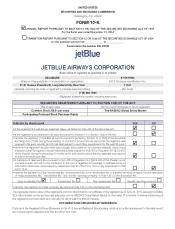
JETBLUE AIRWAYS CORPORATION-2014Annual Report
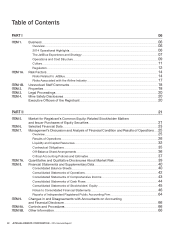
PART I
ITEM 1Business
08
We work to provide a superior air travel experience, including communicating
openly and honestly with customers about delays and service disruptions.
We are the only major U.S. airline to have a Customer Bill of Rights. This
program was introduced in 2007 to provide for compensation to customers
who experience avoidable inconveniences as well as some unavoidable
circumstances. It also commits us to high service standards and holds
us accountable if we do not meet them. In 2014, we completed 97.7%
of our scheduled flights. Unlike most other airlines, we have a policy of
not overbooking flights.
Our customers have repeatedly indicated the distinctive JetBlue Experience
is an important reason why they choose to fly us over other carriers. We
measure and monitor customer feedback regularly which helps us to
continuously improve customer satisfaction. One way we do so is by
measuring our net promoter score, or NPS. This metric is used by companies
in many industries to measure and monitor the customer experience. Many
of the leading consumer brands that are recognized for great customer
service receive high NPS scores. We believe a higher NPS score has
positive effects on customer loyalty and leads to increased revenue.
Network/ High-Value Geography
We are a predominately point-to-point system carrier, with the majority
of our routes touching at least one of our six focus cities of New York,
Boston, Fort Lauderdale-Hollywood, Orlando, Long Beach and San
Juan, Puerto Rico. During 2014, over 86% of our customers flew on
non-stop itineraries.
Airlines with a strong leisure traveler focus are often faced with high
seasonality. As a result, we are continually working to manage our mix of
customers to include business travelers as well as travelers visiting friends
and relatives, or VFR. VFR travelers tend to be slightly less seasonal and
less susceptible to economic downturns than traditional leisure destination
travelers. Understanding the purpose of our customers’ travel helps us
optimize destinations, strengthen our network and increase unit revenues.
All six of our focus cities are in regions with a diverse mix of traffic and
were profitable in 2014.
As of December 31, 2014, our network served 87 BlueCities in 27 states,
the District of Columbia, the Commonwealth of Puerto Rico, the U.S.
Virgin Islands, and 17 countries in the Caribbean and Latin America. In
2014, we commenced service to five new BlueCities including Curaçao,
our 31st BlueCity in the Caribbean and Latin America. We also made
tactical changes across our network by announcing new routes between
existing BlueCities. We group our capacity distribution based upon
geographical regions rather than on mileage or length of haul basis.
The historic distribution for the past three years of available seat miles,
or capacity, by region is:
Capacity Distribution
Year Ended December31,
2014 2013 2012
Caribbean & Latin America(1) 31.4% 28.1% 27.2%
Florida 29.3 30.9 31.1
Transcontinental 26.3 27.9 28.6
East 5.7 5.0 4.9
Central 4.7 5.2 5.0
West 2.6 2.9 3.2
TOTAL 100.0% 100.0% 100.0%
(1) Domestic operations as defined by the Department of Transport, or DOT, include Puerto Rico and the U.S. Virgin Islands, but for the purposes of the capacity distribution table above we have
included these locations in the Caribbean and Latin America region.
Our network growth over the past few years has been focused on the business traveler in Boston as well as travelers to the Caribbean and Latin America
region. Looking to the future we expect to focus on increasing our presence in Fort Lauderdale-Hollywood. We believe there is an opportunity at Fort
Lauderdale-Hollywood to increase our operations to destinations throughout the Caribbean and Latin America. Our plan is supported by significant
investment from the Broward County Aviation Department in the airport and surrounding facilities.
In 2015, we anticipate further expanding our network and have announced the following new destinations:
Destination Service Scheduled to Commence
Cleveland, OH April 30, 2015
Reno, NV May 28, 2015
Grenada* June 11, 2015
* subject to receipt of government operating authority
Airline Commercial Partnerships
Airlines frequently participate in commercial partnerships with other carriers in
order to provide inter-connectivity, code-sharing, coordinated flight schedules,
frequent flyer program reciprocity and other joint marketing activities. As
of December 31, 2014, we had 38 airline commercial partnerships. Our
commercial partnerships typically begin as an interline agreement allowing
a customer to book one itinerary with tickets on multiple airlines. During
2014, we entered into eight new interline agreements. We strengthened
the relationship with one of our existing partners, El Al Airlines, to include
code-sharing. Code-sharing is a practice in which one airline places its
name and flight number on flights operated by another airline. In 2015, we
expect to continue to seek additional strategic opportunities through new
commercial partners as well as assess ways to deepen select current airline
partnerships. We plan do this by expanding code-share relationships and
other areas of cooperation such as frequent flyer programs. We believe
these commercial partnerships allow us to leverage our strong network
and drive incremental traffic and revenue while improving off-peak travel.
Marketing
JetBlue is a widely recognized and respected global brand. This brand
has evolved into an important and valuable asset which identifies us
as a safe, reliable, high value airline. Similarly, we believe customer
awareness of our brand has contributed to the success of our marketing
efforts. It enables us to promote ourselves as a preferred marketing
partner with companies across many different industries.
We market our services through advertising and promotions in various
media forms including popular social media outlets. We engage in
large multi-market programs, local events and sponsorships as well
as mobile marketing programs. Our targeted public and community
relations efforts reflect our commitment to the communities we serve,
as well as promoting brand awareness and complementing our strong
reputation.