JetBlue Airlines 2014 Annual Report Download - page 30
Download and view the complete annual report
Please find page 30 of the 2014 JetBlue Airlines annual report below. You can navigate through the pages in the report by either clicking on the pages listed below, or by using the keyword search tool below to find specific information within the annual report.-
 1
1 -
2
-
3
-
4
-
5
-
6
-
7
-
8
-
9
-
10
-
11
-
12
-
13
-
14
-
15
-
16
-
17
-
18
-
19
-
 20
20 -
 21
21 -
 22
22 -
 23
23 -
 24
24 -
 25
25 -
 26
26 -
 27
27 -
 28
28 -
 29
29 -
 30
30 -
 31
31 -
 32
32 -
 33
33 -
 34
34 -
 35
35 -
 36
36 -
 37
37 -
 38
38 -
 39
39 -
 40
40 -
41
-
42
-
43
-
44
-
45
-
46
-
47
-
48
-
49
-
50
-
51
-
52
-
53
-
54
-
55
-
56
-
57
-
58
-
59
-
60
-
61
-
62
-
63
-
64
-
65
-
66
-
67
-
68
-
69
-
70
-
71
-
72
-
73
-
74
-
75
-
76
-
77
-
78
-
79
-
80
-
81
-
82
-
83
-
84
-
85
-
86
-
87
-
88
-
89
-
90
-
91
-
92
-
93
-
94
-
95
-
96
 |
 |
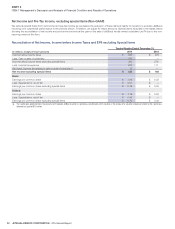
JETBLUE AIRWAYS CORPORATION-2014Annual Report24
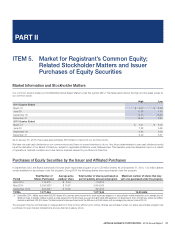
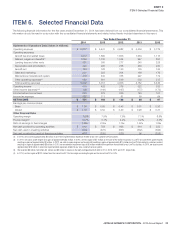
PART II
ITEM6Selected Financial Data
As of December 31,
2014 2013 2012 2011 2010
Balance Sheet Data (in millions):
Cash and cash equivalents $ 341 $ 225 $ 182 $ 673 $ 465
Investment securities 427 516 685 591 628
Total assets 7,839 7,350 7,070 7,071 6,593
Total debt 2,233 2,585 2,851 3,136 3,033
Common stockholders’ equity 2,529 2,134 1,888 1,757 1,654
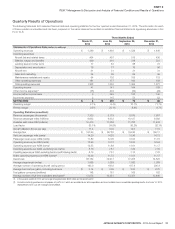
Year Ended December 31,
2014 2013 2012 2011 2010
Operating Statistics (unaudited):
Revenue passengers
(thousands)
32,078 30,463 28,956 26,370 24,254
Revenue passenger miles
(millions)
37,813 35,836 33,563 30,698 28,279
Available seat miles (ASMs)
(millions)
44,994 42,824 40,075 37,232 34,744
Load factor 84.0% 83.7% 83.8% 82.4% 81.4%
Aircraft utilization
(hours per day)
11.8 11.9 11.8 11.7 11.6
Average fare $ 166.57 $ 163.19 $ 157.11 $ 154.74 $ 140.69
Yield per passenger mile
(cents)
14.13 13.87 13.55 13.29 12.07
Passenger revenue per ASM
(cents)
11.88 11.61 11.35 10.96 9.82
Operating revenue per ASM
(cents)
12.93 12.71 12.43 12.10 10.88
Operating expense per ASM
(cents)
11.78 11.71 11.49 11.23 9.92
Operating expense per ASM, excluding fuel
(cents)
7.53 7.28 6.99 6.76 6.71
Operating expense per ASM, excluding fuel and profit
sharing
(cents)
7.48 7.25 6.98 6.76 6.71
Airline operating expense per ASM
(cents)
(5) 11.70 11.56 11.34 11.06 9.71
Departures 294,800 282,133 264,600 243,446 225,501
Average stage length
(miles)
1,088 1,090 1,085 1,091 1,100
Average number of operating aircraft during period 196.2 185.2 173.9 164.9 153.5
Average fuel cost per gallon, including fuel taxes $ 2.99 $ 3.14 $ 3.21 $ 3.17 $ 2.29
Fuel gallons consumed
(millions)
639 604 563 525 486
Average number of full-time equivalent employees(5) 13,280 12,447 12,035 11,532 10,959
(5) Excludes results of operations and employees of LiveTV, LLC, which are unrelated to our airline operations and are immaterial to our consolidated operating results. As of June 10, 2014,
employees of LiveTV, LLC are no longer part of JetBlue.
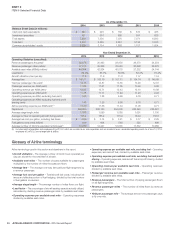
Glossary of Airline terminology
Airline terminology used in this section and elsewhere in this report:
•
Aircraft utilization – The average number of block hours operated per
day per aircraft for the total fleet of aircraft.
•
Available seat miles – The number of seats available for passengers
multiplied by the number of miles the seats are flown.
•
Average fare – The average one-way fare paid per flight segment by
a revenue passenger.
•
Average fuel cost per gallon – Total aircraft fuel costs, including fuel
taxes and effective portion of fuel hedging, divided by the total number
of fuel gallons consumed.
•Average stage length – The average number of miles flown per flight.
•
Load factor – The percentage of aircraft seating capacity actually utilized,
calculated by dividing revenue passenger miles by available seat miles.
•
Operating expense per available seat mile – Operating expenses
divided by available seat miles.
•
Operating expense per available seat mile, excluding fuel – Operating
expenses, less aircraft fuel, divided by available seat miles.
•
Operating expense per available seat mile, excluding fuel and profit
sharing – Operating expenses, less aircraft fuel and profit sharing, divided
by available seat miles.
•
Operating revenue per available seat mile – Operating revenues
divided by available seat miles.
•
Passenger revenue per available seat mile – Passenger revenue
divided by available seat miles.
•Revenue passengers – The total number of paying passengers flown
on all flight segments.
•
Revenue passenger miles – The number of miles flown by revenue
passengers.
•
Yield per passenger mile – The average amount one passenger pays
to fly one mile.