JetBlue Airlines 2014 Annual Report Download - page 33
Download and view the complete annual report
Please find page 33 of the 2014 JetBlue Airlines annual report below. You can navigate through the pages in the report by either clicking on the pages listed below, or by using the keyword search tool below to find specific information within the annual report.-
 1
1 -
2
-
3
-
4
-
5
-
6
-
7
-
8
-
9
-
10
-
11
-
12
-
13
-
14
-
15
-
16
-
17
-
18
-
19
-
20
-
21
-
22
-
 23
23 -
 24
24 -
 25
25 -
 26
26 -
 27
27 -
 28
28 -
 29
29 -
 30
30 -
 31
31 -
 32
32 -
 33
33 -
 34
34 -
 35
35 -
 36
36 -
 37
37 -
 38
38 -
 39
39 -
 40
40 -
 41
41 -
 42
42 -
 43
43 -
44
-
45
-
46
-
47
-
48
-
49
-
50
-
51
-
52
-
53
-
54
-
55
-
56
-
57
-
58
-
59
-
60
-
61
-
62
-
63
-
64
-
65
-
66
-
67
-
68
-
69
-
70
-
71
-
72
-
73
-
74
-
75
-
76
-
77
-
78
-
79
-
80
-
81
-
82
-
83
-
84
-
85
-
86
-
87
-
88
-
89
-
90
-
91
-
92
-
93
-
94
-
95
-
96
 |
 |
JETBLUE AIRWAYS CORPORATION-2014Annual Report 27
PART II
ITEM7Management’s Discussion and Analysis of Financial Condition and Results of Operations
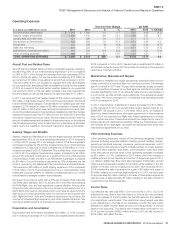
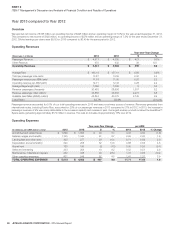
Operating Expenses
(in millions; per ASM data in cents)
2014 2013
Year-over-Year Change per ASM
$%2014 2013 % Change
Aircraft fuel and related taxes $ 1,912 $ 1,899 13 0.7 4.25 4.43 (4.1)
Salaries, wages and benefits 1,294 1,135 159 14.1 2.88 2.65 8.7
Landing fees and other rents 321 305 16 5.3 0.71 0.71 —
Depreciation and amortization 320 290 30 10.2 0.71 0.68 4.4
Aircraft rent 124 128 (4) (3.4) 0.28 0.30 (6.7)
Sales and marketing 231 223 8 3.4 0.51 0.52 (1.9)
Maintenance, materials and repairs 418 432 (14) (3.4) 0.93 1.01 (7.9)
Other operating expenses 682 601 81 13.5 1.51 1.41 7.1
TOTAL OPERATING EXPENSES $ 5,302 $ 5,013 $ 289 5.7 11.78 11.71 0.6
Aircraft Fuel and Related Taxes
Aircraft fuel and related taxes remains our largest expense category,
representing 36% of our total operating expenses in 2014 compared
to 38% in 2013. Even though the average fuel price decreased 5% in
2014 to $2.99 per gallon, our fuel expenses increased by $13 million as
we consumed 35 million more gallons of aircraft fuel compared to 2013.
This was mainly due to our increase in capacity and was offset slightly
by our higher than anticipated flight cancellations during the first quarter
of 2014 as a result of the harsh winter weather. Based on our expected
fuel volume for 2015, a 10% per gallon increase in the cost of aircraft fuel
would increase our annual fuel expense by approximately $175 million.
In 2014, we recorded fuel hedge losses of $30 million compared to
$10 million in fuel hedge losses in 2013 which were recorded in the aircraft
fuel and related taxes category. Fuel derivatives not qualifying as cash flow
hedges in 2014 resulted in a gain of $2 million compared to losses of less
than $1 million in 2013 which were recorded in interest income and other.
Accounting ineffectiveness on fuel derivatives classified as cash flow hedges
resulted in losses of less than $1 million in both 2014 and 2013 and were
recorded in interest income and other. We are unable to predict what the
amount of ineffectiveness will be related to these instruments, or the potential
loss of hedge accounting which is determined on a derivative-by-derivative
basis, due to the volatility in the forward markets for these commodities.
Salaries, Wages and Benefits
Salaries, Wages and Benefits are our second largest expense, representing
approximately 24% of our total operating expenses in 2014 compared
to 23% in 2013. During 2014, the average number of full-time equivalent
employees increased by 7% and the average tenure of our Crewmembers
increased to 6.2 years, both of which contributed to a $159 million, or 14.1%,
increase compared to 2013. Retirement Plus contributions, which equate
to 5% of all of our eligible Crewmembers wages, increased by $4 million
and our 3% retirement contribution for a certain portion of our FAA-licensed
Crewmembers, which we refer to as Retirement Advantage, increased
by $3 million. Our profit sharing is calculated as 15% of adjusted pre-tax
income, reduced by the Retirement Plus contributions and special items.
This resulted in $25 million of profit sharing expense in 2014 compared
to $12 million in 2013. The increasing tenure of our Crewmembers, rising
healthcare costs and efforts to maintain competitiveness in our overall
compensation packages present cost pressures.
We agreed to provide our pilots with a 20% pay increase in their base rate
over three years starting in 2014. In January 2014, the FAA’s rule amending
the FAA’s flight, duty, and rest regulations became effective. Among other
things, the new rule requires a ten hour minimum rest period prior to a
pilot’s flight duty period; mandates a pilot must have an opportunity for
eight hours of uninterrupted sleep within the rest period; and imposes new
pilot “flight time” and “duty time” limitations based upon report times, the
number of scheduled flight segments, and other operational factors. We
have hired additional pilots to address the requirements of the new rule.
Depreciation and Amortization
Depreciation and amortization increased $30 million, or 10%, primarily
due to having an average of 137 owned and capital leased aircraft in
2014 compared to 125 in 2013. We also had an additional $13 million in
amortization expense during 2014 as a result of a change in the expected
useful lives of certain software.
Maintenance, Materials and Repairs
Maintenance, materials and repairs are generally expensed when incurred
unless covered by a long-term flight hour services contract. The average
age of our aircraft in 2014 was 7.8 years which is relatively young compared
to our competitors. However, as our fleet ages our maintenance costs will
increase significantly, both on an absolute basis and as a percentage of
our unit costs, as older aircraft require additional, more expensive repairs
over time. We had an average of 11.0 additional total operating aircraft
in 2014 compared to 2013.
In 2014, maintenance, materials and repairs decreased by $14 million,
or 3% compared to 2013 as we had higher engine related costs for our
EMBRAER 190 aircraft in 2013. In the latter half of 2013, we finalized a
flight-hour based maintenance and repair agreement for these engines
and in 2014 we amended our flight-hour based agreements to include
other certain services. These amendments are expected to result in
better planning of maintenance activities. While our maintenance costs
will increase as our fleet ages, we expect we will benefit from these new
maintenance agreements for our fleet.
Other Operating Expenses
Other operating expenses consist of the following categories: outside
services (including expenses related to fueling, ground handling, skycap,
security and janitorial services), insurance, personnel expenses, cost of
goods sold to other airlines by LiveTV, professional fees, on-board supplies,
shop and office supplies, bad debts, communication costs and taxes
other than payroll and fuel taxes. Other operating expenses increased
by $81 million, or 14%, compared to 2013 mainly due to an increase in
outside services. As our capacity and number of departures grew in 2014,
our related variable handling costs also increased. Additionally, we had
higher personnel expenses relating to the harsh winter weather in the first
quarter of the year such as lodging and per diem. Non-recurring items in
2014 included the sale of an engine for a gain of $3 million and a gain of
$4 million relating to a one-time legal settlement. In 2013, we had a gain
of approximately $2 million relating to the sale of three spare engines as
well as a gain of approximately $7 million relating to the sale of LiveTV’s
investment in the Airfone business.
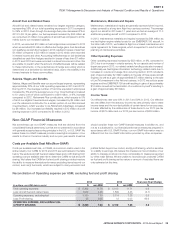
Income Taxes
Our effective tax rate was 36% in 2014 and 40% in 2013. Our 2014
effective tax rate differs from the statutory income tax rate primarily
due to the release of the $19 million tax benefit related to the utilization
of a capital loss carryforward. This capital loss carryforward was able
to be utilized due to the sale of our subsidiary, LiveTV. The rate is also
affected by state income taxes and the non-deductibility of certain
items for tax purposes. The relative size of these items compared to our
2014 pre-tax income of $623 million and our 2013 pre-tax income of
$279 million also affect the rate.