JCPenney 2008 Annual Report Download - page 21
Download and view the complete annual report
Please find page 21 of the 2008 JCPenney annual report below. You can navigate through the pages in the report by either clicking on the pages listed below, or by using the keyword search tool below to find specific information within the annual report.-
 1
1 -
2
-
3
-
4
-
5
-
6
-
7
-
8
-
9
-
10
-
 11
11 -
 12
12 -
 13
13 -
 14
14 -
 15
15 -
 16
16 -
 17
17 -
 18
18 -
 19
19 -
 20
20 -
 21
21 -
 22
22 -
 23
23 -
 24
24
 |
 |
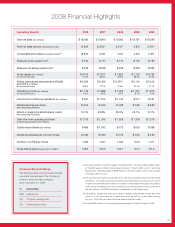
(1) Includes the effect of the 53rd week in 2006 and 2003. Excluding sales of $254 million
for the 53rd week in 2006, total net sales increased 1.1% and 4.6% for 2007 and 2006,
respectively. Excluding sales of $198 million for the 53rd week in 2003, total net sales
increased 4.5% for 2004.
(2) Comparable store sales include sales from new and relocated stores that have been
opened for 12 consecutive full scal months and online sales through jcp.com. Stores
closed for an extended period are not included in comparable store sales calculations,
while stores remodeled and minor expansions not requiring store closures remain in
the calculations. The 2006 calculation is presented on a 52-week basis.
(3) Calculations include the sales and square footage of department stores that were
open for a full scal year as of each year end, as well as online sales through
jcp.com. The 2006 calculations exclude sales of the 53rd week.
(4) Includes $65 million of incremental expenses related to the 53rd week of 2006.
21
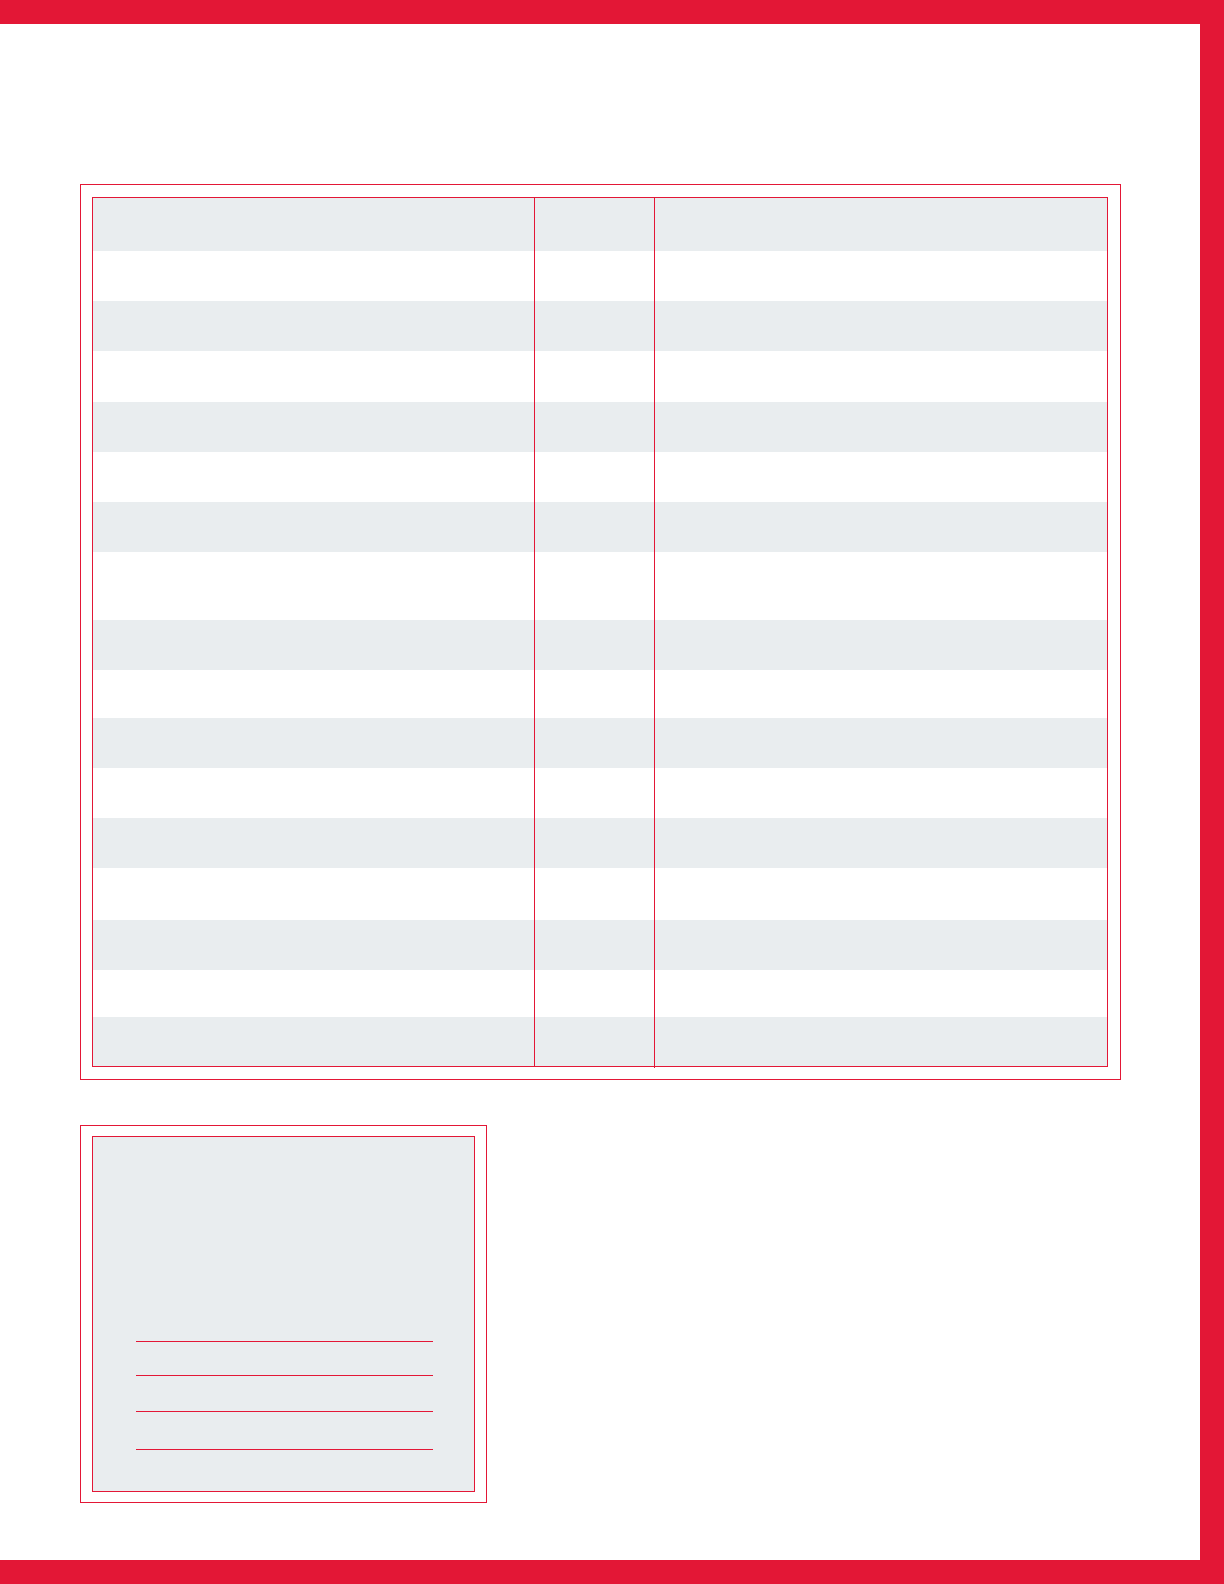
2008 Financial Highlights
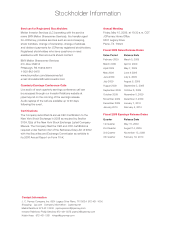
Common Stock Holdings
The following table shows the approximate
ownership percentage of the Company’s
common stock by major category
as of December 31, 2008:
% Ownership
83% Institutional
8% Company savings plan
9% Individual and other
Operating Results 2008 2007 2006 2005 2004
Total net sales ($ in millions) $ 18,486 $ 19,860 $ 19,903 $ 18,781 $ 18,096
Total net sales percent (decrease)/increase (6.9)% (0.2)%(1) 6.0%(1) 3.8% 3.3%(1)
Comparable store sales (decrease)/increase(2) (8.5)% 0.0% 4.9% 4.2% 5.9%
Sales per gross square foot(3) $ 160 $ 177 $ 176 $ 167 $ 159
Sales per net selling square foot(3) $ 223 $ 248 $ 248 $ 236 $ 225
Gross margin ($ in millions) $ 6,915 $ 7,671 $ 7,825 $ 7,191 $ 6,792
As a percent of sales 37.4% 38.6% 39.3% 38.3% 37.5%
Selling, general and administrative (SG&A) $ 5,395 $ 5,402 $ 5,470(4) $ 5,115 $ 5,015
expenses ($ in millions)
As a percent of sales 29.2% 27.2% 27.5% 27.2% 27.7%
Operating income ($ in millions) $ 1,135 $ 1,888 $ 1,922 $ 1, 631 $ 1,275
As a percent of sales 6.1% 9.5% 9.7% 8.7% 7.0%
Income from continuing operations ($ in millions) $ 567 $ 1,105 $ 1,134 $ 977 $ 657
Diluted earnings per share $ 2.54 $ 4.90 $ 4.88 $ 3.83 $ 2.20
from continuing operations
Return on beginning stockholders’ equity 10.7% 25.8% 28.3% 20.1% 12.1%
from continuing operations
Cash ow from operating activities $ 1,155 $ 1,249 $ 1,258 $ 1,339 $ 1,219
of continuing operations ($ in millions)
Capital expenditures ($ in millions) $ 969 $ 1,243 $ 772 $ 535 $ 398
Dividends declared per common share $ 0.80 $ 0.80 $ 0.72 $ 0.50 $ 0.50
Number of JCPenney stores 1,093 1,067 1,033 1,019 1,017
Gross selling space (square feet in millions) 109.9 106.6 103.1 101.4 101.3