Huntington National Bank 2011 Annual Report Download - page 2
Download and view the complete annual report
Please find page 2 of the 2011 Huntington National Bank annual report below. You can navigate through the pages in the report by either clicking on the pages listed below, or by using the keyword search tool below to find specific information within the annual report.-
 1
1 -
 2
2 -
 3
3 -
 4
4 -
 5
5 -
 6
6 -
 7
7 -
 8
8 -
 9
9 -
 10
10 -
 11
11 -
 12
12 -
 13
13 -
14
-
15
-
16
-
17
-
18
-
19
-
20
-
21
-
22
-
23
-
24
-
25
-
26
-
27
-
28
-
29
-
30
-
31
-
32
-
33
-
34
-
35
-
36
-
37
-
38
-
39
-
40
-
41
-
42
-
43
-
44
-
45
-
46
-
47
-
48
-
49
-
50
-
51
-
52
-
53
-
54
-
55
-
56
-
57
-
58
-
59
-
60
-
61
-
62
-
63
-
64
-
65
-
66
-
67
-
68
-
69
-
70
-
71
-
72
-
73
-
74
-
75
-
76
-
77
-
78
-
79
-
80
-
81
-
82
-
83
-
84
-
85
-
86
-
87
-
88
-
89
-
90
-
91
-
92
-
93
-
94
-
95
-
96
-
97
-
98
-
99
-
100
-
101
-
102
-
103
-
104
-
105
-
106
-
107
-
108
-
109
-
110
-
111
-
112
-
113
-
114
-
115
-
116
-
117
-
118
-
119
-
120
-
121
-
122
-
123
-
124
-
125
-
126
-
127
-
128
-
129
-
130
-
131
-
132
-
133
-
134
-
135
-
136
-
137
-
138
-
139
-
140
-
141
-
142
-
143
-
144
-
145
-
146
-
147
-
148
-
149
-
150
-
151
-
152
-
153
-
154
-
155
-
156
-
157
-
158
-
159
-
160
-
161
-
162
-
163
-
164
-
165
-
166
-
167
-
168
-
169
-
170
-
171
-
172
-
173
-
174
-
175
-
176
-
177
-
178
-
179
-
180
-
181
-
182
-
183
-
184
-
185
-
186
-
187
-
188
-
189
-
190
-
191
-
192
-
193
-
194
-
195
-
196
-
197
-
198
-
199
-
200
-
201
-
202
-
203
-
204
-
205
-
206
-
207
-
208
-
209
-
210
-
211
-
212
-
213
-
214
-
215
-
216
-
217
-
218
-
219
-
220
-
221
-
222
-
223
-
224
-
225
-
226
-
227
-
228
-
229
-
230
-
231
-
232
-
233
-
234
-
235
-
236
 |
 |

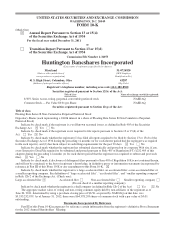
Huntington Bancshares Incorporated is a $54 billion regional bank holding company headquartered in Columbus,
Ohio. The Huntington National Bank, founded in 1866, provides full-service commercial, small business, and
consumer banking services; mortgage banking services; treasury management and foreign exchange services;
equipment leasing; wealth and investment management services; trust services; brokerage services; customized
insurance brokerage and service programs; and other financial products and services. The principal markets for
these services are Huntington’s six-state banking franchise: Ohio, Michigan, Pennsylvania, Indiana, West
Virginia, and Kentucky. The primary distribution channels include a banking network of over 600 traditional
branches and convenience branches located in grocery stores, and through an array of alternative distribution
channels including internet and mobile banking, telephone banking, and over 1,300 ATMs. Through automotive
dealership relationships within its six-state banking franchise area and selected other Midwest and New England
states, Huntington also provides commercial banking services to the automotive dealers and retail automobile
financing for dealer customers.
CONSOLIDATED FINANCIAL HIGHLIGHTS
(In millions, except per share amounts) 2011 2010 Change
NET INCOME (LOSS) $ 542.6 $ 312.3 $ 230.3 74%
PER COMMON SHARE AMOUNTS
Net income (loss) per common share – diluted ......................................... $ 0.59 $ 0.19 $ 0.40 211%
Cash dividend declared per common share ............................................ 0.10 0.04 0.06 150
Tangible book value per common share(1) ............................................ 5.18 4.66 0.52 11
PERFORMANCE RATIOS
Return on average total assets ...................................................... 1.01% 0.59% 0.42%
Return on average tangible common shareholders’ equity ................................ 12.7 5.6 7.1
Net interest margin(2) ............................................................. 3.38 3.44 (0.06)
Efficiency ratio(3) ................................................................ 63.7 60.4 3.3
CAPITAL RATIOS
Tier 1 risk-based capital ratio(1) .................................................... 12.11% 11.55% 0.56%
Total risk-based capital ratio(1) ..................................................... 14.77 14.46 0.31
Tangible equity/tangible assets ratio(1)(4)(8) ............................................ 9.02 8.24 0.78
Tangible common equity/tangible asset ratio(1)(5)(8) ..................................... 8.30 7.56 0.74
CREDIT QUALITY MEASURES
Net charge-offs (NCOs) .......................................................... $ 437.1 $ 874.5 $ (437.4) (50)%
NCOs as a % of average loans and leases ............................................. 1.12% 2.35% (1.23)%
Non-accrual loans (NALs)(1) ....................................................... $ 541.1 $ 778.0 $ (236.9) (30)%
NAL ratio(1) (6) .................................................................. 1.39% 2.04% (65)%
Non-performing assets (NPAs)(1) ................................................... $ 590.3 $ 844.8 $ (254.5) (30)%
NPA ratio(1) (7) .................................................................. 1.51% 2.21% (70)%
Allowance for credit losses (ACL)(1) ................................................ $ 1,013.3 $ 1,291.1 $ (277.8) (22)%
ACL as a % of total loans and leases(1) ............................................... 2.60% 3.39% (79)%
ACL as a % of NALs(1) ........................................................... 187 166 21
BALANCE SHEET – DECEMBER 31,
Total loans and leases ............................................................ $38,923.8 $38,106.5 $ 817.3 2%
Total assets .................................................................... 54,450.7 53,819.6 631.1 1
Total deposits .................................................................. 43,279.6 41,853.9 1,425.7 3
Total shareholders’ equity ......................................................... 5,418.1 4,980.5 437.6 9
(1) At December 31.
(2) On a fully-taxable equivalent (FTE) basis assuming a 35% tax rate.
(3) Noninterest expense less amortization of intangibles and goodwill impairment divided by the sum of FTE net interest income and
noninterest income excluding securities losses.
(4) Tangible equity (total equity less goodwill and other intangible assets) divided by tangible assets (total assets less goodwill and other
intangible assets). Other intangible assets are net of deferred tax and calculated assuming a 35% tax rate.
(5) Tangible common equity (total common equity less goodwill and other intangible assets) divided by tangible assets (total assets less
goodwill and other intangible assets). Other intangible assets are net of deferred tax and calculated assuming a 35% tax rate.
(6) NALs divided by total loans and leases.
(7) NPAs divided by the sum of total loans and leases, impaired loans held-for-sale, and net other real estate.
(8) Tangible equity, tangible common equity, and tangible assets are non-GAAP financial measures. Additionally, any ratios utilizing these
financial measures are also non-GAAP. These financial measures have been included as they are considered to be critical metrics with
which to analyze and evaluate financial condition and capital strength. Other companies may calculate these financial measures
differently.