Huntington National Bank 2011 Annual Report Download - page 17
Download and view the complete annual report
Please find page 17 of the 2011 Huntington National Bank annual report below. You can navigate through the pages in the report by either clicking on the pages listed below, or by using the keyword search tool below to find specific information within the annual report.-
 1
1 -
2
-
3
-
4
-
5
-
6
-
 7
7 -
 8
8 -
 9
9 -
 10
10 -
 11
11 -
 12
12 -
 13
13 -
 14
14 -
 15
15 -
 16
16 -
 17
17 -
 18
18 -
 19
19 -
 20
20 -
 21
21 -
 22
22 -
 23
23 -
 24
24 -
 25
25 -
 26
26 -
 27
27 -
28
-
29
-
30
-
31
-
32
-
33
-
34
-
35
-
36
-
37
-
38
-
39
-
40
-
41
-
42
-
43
-
44
-
45
-
46
-
47
-
48
-
49
-
50
-
51
-
52
-
53
-
54
-
55
-
56
-
57
-
58
-
59
-
60
-
61
-
62
-
63
-
64
-
65
-
66
-
67
-
68
-
69
-
70
-
71
-
72
-
73
-
74
-
75
-
76
-
77
-
78
-
79
-
80
-
81
-
82
-
83
-
84
-
85
-
86
-
87
-
88
-
89
-
90
-
91
-
92
-
93
-
94
-
95
-
96
-
97
-
98
-
99
-
100
-
101
-
102
-
103
-
104
-
105
-
106
-
107
-
108
-
109
-
110
-
111
-
112
-
113
-
114
-
115
-
116
-
117
-
118
-
119
-
120
-
121
-
122
-
123
-
124
-
125
-
126
-
127
-
128
-
129
-
130
-
131
-
132
-
133
-
134
-
135
-
136
-
137
-
138
-
139
-
140
-
141
-
142
-
143
-
144
-
145
-
146
-
147
-
148
-
149
-
150
-
151
-
152
-
153
-
154
-
155
-
156
-
157
-
158
-
159
-
160
-
161
-
162
-
163
-
164
-
165
-
166
-
167
-
168
-
169
-
170
-
171
-
172
-
173
-
174
-
175
-
176
-
177
-
178
-
179
-
180
-
181
-
182
-
183
-
184
-
185
-
186
-
187
-
188
-
189
-
190
-
191
-
192
-
193
-
194
-
195
-
196
-
197
-
198
-
199
-
200
-
201
-
202
-
203
-
204
-
205
-
206
-
207
-
208
-
209
-
210
-
211
-
212
-
213
-
214
-
215
-
216
-
217
-
218
-
219
-
220
-
221
-
222
-
223
-
224
-
225
-
226
-
227
-
228
-
229
-
230
-
231
-
232
-
233
-
234
-
235
-
236
 |
 |

The financial results for each of these business segments are included in Note 25 of Notes to Consolidated
Financial Statements and are discussed in the Business Segment Discussion of our MD&A.
Competition
Although there has been consolidation in the financial services industry, our markets remain competitive.
We compete with other banks and financial services companies such as savings and loans, credit unions, and
finance and trust companies, as well as mortgage banking companies, automobile and equipment financing
companies (including captive automobile finance companies), insurance companies, mutual funds, investment
advisors, and brokerage firms, both within and outside of our primary market areas. Internet companies are also
providing nontraditional, but increasingly strong, competition for our borrowers, depositors, and other customers.
We compete for loans primarily on the basis of a combination of value and service by building customer
relationships as a result of addressing our customers’ entire suite of banking needs, demonstrating expertise, and
providing convenience to our customers. We also consider the competitive pricing pressures in each of our
markets.
We compete for deposits similarly on a basis of a combination of value and service and by providing
convenience through a banking network of over 600 branches and over 1,300 ATMs within our markets and our
award-winning website at www.huntington.com. We have also instituted new and more customer friendly
practices, such as our 24-Hour Grace®account feature, which gives customers an additional business day to
cover overdrafts to their consumer account without being charged overdraft fees.
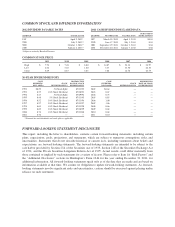
The table below shows our competitive ranking and market share based on deposits of FDIC-insured
institutions as of June 30, 2011, in the top 12 metropolitan statistical areas (MSA) in which we compete:
MSA Rank Deposits Market Share
(in millions)
Columbus, OH ........................................ 1 $10,318 24%
Cleveland, OH ........................................ 5 4,056 8
Detroit, MI ........................................... 8 3,239 4
Toledo, OH ........................................... 1 2,350 24
Pittsburgh, PA ........................................ 8 2,342 3
Cincinnati, OH ........................................ 5 2,101 3
Indianapolis, IN ....................................... 4 2,061 7
Youngstown, OH ...................................... 1 1,915 21
Canton, OH ........................................... 1 1,557 28
Grand Rapids, MI ...................................... 3 1,353 11
Akron, OH ........................................... 5 896 8
Charleston, WV ....................................... 4 594 10
Source: FDIC.gov, based on June 30, 2011 survey.
Many of our nonfinancial institution competitors have fewer regulatory constraints, broader geographic
service areas, greater capital, and, in some cases, lower cost structures. In addition, competition for quality
customers has intensified as a result of changes in regulation, advances in technology and product delivery
systems, consolidation among financial service providers, bank failures, and the conversion of certain former
investment banks to bank holding companies.
3