Honeywell 2015 Annual Report Download - page 81
Download and view the complete annual report
Please find page 81 of the 2015 Honeywell annual report below. You can navigate through the pages in the report by either clicking on the pages listed below, or by using the keyword search tool below to find specific information within the annual report.-
 1
1 -
2
-
3
-
4
-
5
-
6
-
7
-
8
-
9
-
10
-
11
-
12
-
13
-
14
-
15
-
16
-
17
-
18
-
19
-
20
-
21
-
22
-
23
-
24
-
25
-
26
-
27
-
28
-
29
-
30
-
31
-
32
-
33
-
34
-
35
-
36
-
37
-
38
-
39
-
40
-
41
-
42
-
43
-
44
-
45
-
46
-
47
-
48
-
49
-
50
-
51
-
52
-
53
-
54
-
55
-
56
-
57
-
58
-
59
-
60
-
61
-
62
-
63
-
64
-
65
-
66
-
67
-
68
-
69
-
70
-
 71
71 -
 72
72 -
 73
73 -
 74
74 -
 75
75 -
 76
76 -
 77
77 -
 78
78 -
 79
79 -
 80
80 -
 81
81 -
 82
82 -
 83
83 -
 84
84 -
 85
85 -
 86
86 -
 87
87 -
 88
88 -
 89
89 -
 90
90 -
 91
91 -
92
-
93
-
94
-
95
-
96
-
97
-
98
-
99
-
100
-
101
-
102
-
103
-
104
-
105
-
106
-
107
-
108
-
109
-
110
 |
 |
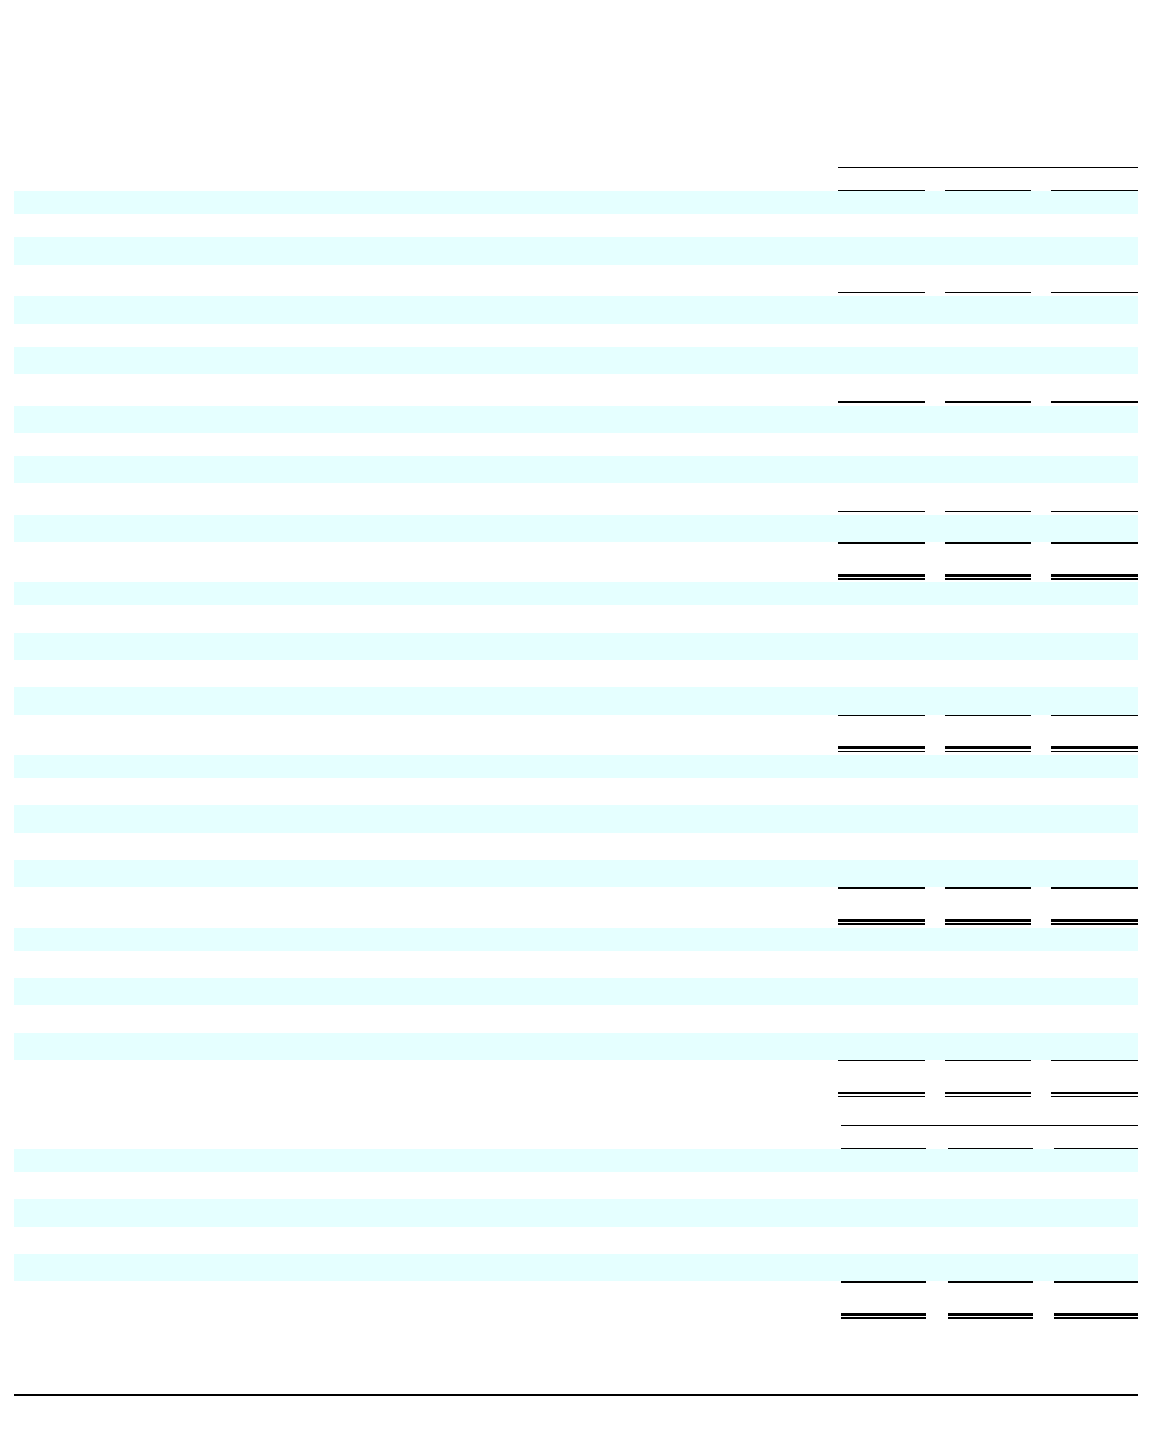
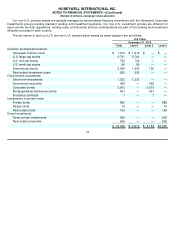
HONEYWELL INTERNATIONAL INC.
NOTES TO FINANCIAL STATEMENTS
—(Continued)
(Dollars in millions, except per share amounts)
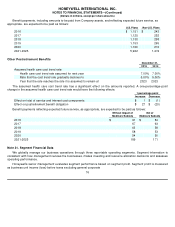
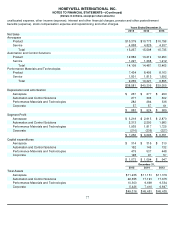
unallocated expense, other income (expense), interest and other financial charges, pension and other postretirement
benefits (expense), stock compensation expense and repositioning and other charges.
77
Years Ended December 31,
2015
2014
2013
Net Sales
Aerospace
Product
$
10,379
$
10,773
$
10,798
Service
4,858
4,825
4,937
Total
15,237
15,598
15,735
Automation and Control Solutions
Product
12,882
13,219
12,253
Service
1,227
1,268
1,212
Total
14,109
14,487
13,465
Performance Materials and Technologies
Product
7,434
8,406
8,163
Service
1,801
1,815
1,692
Total
9,235
10,221
9,855
$
38,581
$
40,306
$
39,055
Depreciation and amortization
Aerospace
$
267
$
277
$
290
Automation and Control Solutions
277
306
302
Performance Materials and Technologies
282
284
336
Corporate
57
57
61
$
883
$
924
$
989
Segment Profit
Aerospace
$
3,218
$
2,915
$
2,870
Automation and Control Solutions
2,313
2,200
1,983
Performance Materials and Technologies
1,935
1,817
1,725
Corporate
(210
)
(236
)
(227
)
$
7,256
$
6,696
$
6,351
Capital expenditures
Aerospace
$
314
$
315
$
310
Automation and Control Solutions
152
145
132
Performance Materials and Technologies
479
537
448
Corporate
128
97
57
$
1,073
$
1,094
$
947
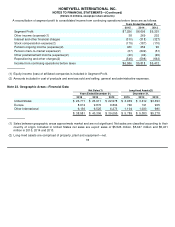
December 31,
2015
2014
2013
Total Assets
Aerospace
$
11,235
$
11,151
$
11,379
Automation and Control Solutions
22,355
17,191
17,675
Performance Materials and Technologies
10,300
9,699
9,534
Corporate
5,426
7,410
6,847
$
49,316
$
45,451
$
45,435