Honeywell 2015 Annual Report Download - page 75
Download and view the complete annual report
Please find page 75 of the 2015 Honeywell annual report below. You can navigate through the pages in the report by either clicking on the pages listed below, or by using the keyword search tool below to find specific information within the annual report.-
 1
1 -
2
-
3
-
4
-
5
-
6
-
7
-
8
-
9
-
10
-
11
-
12
-
13
-
14
-
15
-
16
-
17
-
18
-
19
-
20
-
21
-
22
-
23
-
24
-
25
-
26
-
27
-
28
-
29
-
30
-
31
-
32
-
33
-
34
-
35
-
36
-
37
-
38
-
39
-
40
-
41
-
42
-
43
-
44
-
45
-
46
-
47
-
48
-
49
-
50
-
51
-
52
-
53
-
54
-
55
-
56
-
57
-
58
-
59
-
60
-
61
-
62
-
63
-
64
-
 65
65 -
 66
66 -
 67
67 -
 68
68 -
 69
69 -
 70
70 -
 71
71 -
 72
72 -
 73
73 -
 74
74 -
 75
75 -
 76
76 -
 77
77 -
 78
78 -
 79
79 -
 80
80 -
 81
81 -
 82
82 -
 83
83 -
 84
84 -
 85
85 -
86
-
87
-
88
-
89
-
90
-
91
-
92
-
93
-
94
-
95
-
96
-
97
-
98
-
99
-
100
-
101
-
102
-
103
-
104
-
105
-
106
-
107
-
108
-
109
-
110
 |
 |

HONEYWELL INTERNATIONAL INC.
NOTES TO FINANCIAL STATEMENTS
—(Continued)
(Dollars in millions, except per share amounts)
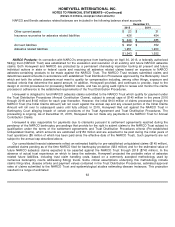
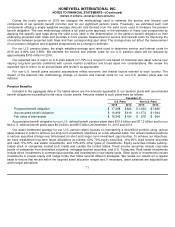
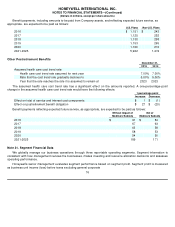
During the fourth quarter of 2015 we changed the methodology used to estimate the service and interest cost
components of net periodic benefit (income) cost for our significant pension plans. Previously, we estimated such cost
components utilizing a single weighted-average discount rate derived from the yield curve used to measure the pension
benefit obligation. The new methodology utilizes a full yield curve approach in the estimation of these cost components by
applying the specific spot rates along the yield curve used in the determination of the pension benefit obligation to their
underlying projected cash flows and provides a more precise measurement of service and interest costs by improving the
correlation between projected cash flows and their corresponding spot rates. The change does not affect the measurement
of our pension obligation and is applied prospectively as a change in estimate.
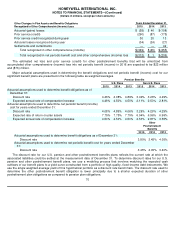
For our U.S. pension plans, the single weighted-average spot rates used to determine service and interest costs for
2016 are 4.69% and 3.59%. We estimate the service and interest costs for our U.S. pension plans will be reduced by
approximately $150 million in 2016.
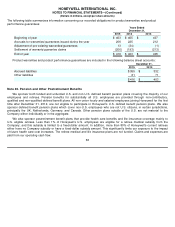
Our expected rate of return on U.S. plan assets of 7.75% is a long-term rate based on historical plan asset returns over
varying long-term periods combined with current market conditions and broad asset mix considerations. We review the
expected rate of return on an annual basis and revise it as appropriate.
For non-U.S. benefit plans actuarial assumptions reflect economic and market factors relevant to each country. The
impact of the discount rate methodology change on service and interest costs for our non-U.S. pension plans was not
material.
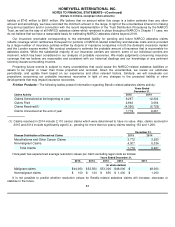
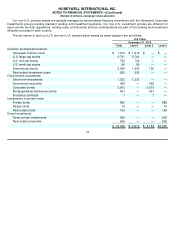
Pension Benefits
Included in the aggregate data in the tables above are the amounts applicable to our pension plans with accumulated
benefit obligations exceeding the fair value of plan assets. Amounts related to such plans were as follows:
Accumulated benefit obligation for our U.S. defined benefit pension plans were $16.9 billion and $17.2 billion and for our
Non
-U.S. defined benefit plans were $6.2 billion and $5.5 billion at December 31, 2015 and 2014.
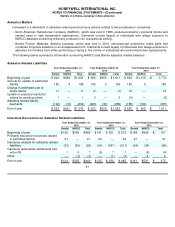
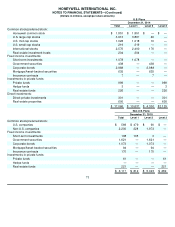
Our asset investment strategy for our U.S. pension plans focuses on maintaining a diversified portfolio using various
asset classes in order to achieve our long-term investment objectives on a risk adjusted basis. Our actual invested positions
in various securities change over time based on short and longer- term investment opportunities. To achieve our objectives,
we have established long-term target allocations as follows: 60%-70% equity securities, 10%-20% fixed income securities
and cash, 5%-15% real estate investments, and 10%-20% other types of investments. Equity securities include publicly-
traded stock of companies located both inside and outside the United States. Fixed income securities include corporate
bonds of companies from diversified industries, mortgage-backed securities, and U.S. Treasuries. Real estate investments
include direct investments in commercial properties and investments in real estate funds. Other types of investments include
investments in private equity and hedge funds that follow several different strategies. We review our assets on a regular
basis to ensure that we are within the targeted asset allocation ranges and, if necessary, asset balances are adjusted back
within target allocations.
71
December 31,
U.S. Plans
Non
-
U.S. Plans
2015
2014
2015
2014
Projected benefit obligation
$
17,298
$
626
$
1,624
$
1,686
Accumulated benefit obligation
$
16,899
$
618
$
1,574
$
1,584
Fair value of plan assets
$
16,349
$
194
$
976
$
994