Honeywell 2015 Annual Report Download - page 49
Download and view the complete annual report
Please find page 49 of the 2015 Honeywell annual report below. You can navigate through the pages in the report by either clicking on the pages listed below, or by using the keyword search tool below to find specific information within the annual report.-
 1
1 -
2
-
3
-
4
-
5
-
6
-
7
-
8
-
9
-
10
-
11
-
12
-
13
-
14
-
15
-
16
-
17
-
18
-
19
-
20
-
21
-
22
-
23
-
24
-
25
-
26
-
27
-
28
-
29
-
30
-
31
-
32
-
33
-
34
-
35
-
36
-
37
-
38
-
 39
39 -
 40
40 -
 41
41 -
 42
42 -
 43
43 -
 44
44 -
 45
45 -
 46
46 -
 47
47 -
 48
48 -
 49
49 -
 50
50 -
 51
51 -
 52
52 -
 53
53 -
 54
54 -
 55
55 -
 56
56 -
 57
57 -
 58
58 -
 59
59 -
60
-
61
-
62
-
63
-
64
-
65
-
66
-
67
-
68
-
69
-
70
-
71
-
72
-
73
-
74
-
75
-
76
-
77
-
78
-
79
-
80
-
81
-
82
-
83
-
84
-
85
-
86
-
87
-
88
-
89
-
90
-
91
-
92
-
93
-
94
-
95
-
96
-
97
-
98
-
99
-
100
-
101
-
102
-
103
-
104
-
105
-
106
-
107
-
108
-
109
-
110
 |
 |

HONEYWELL INTERNATIONAL INC.
NOTES TO FINANCIAL STATEMENTS
—(Continued)
(Dollars in millions, except per share amounts)
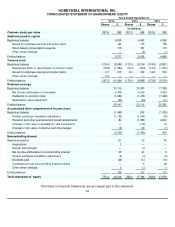
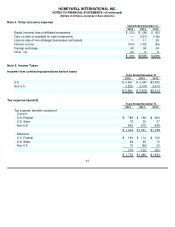
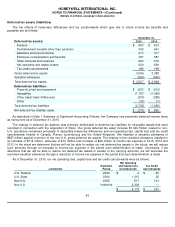
Deferred tax assets (liabilities)
The tax effects of temporary differences and tax carryforwards which give rise to future income tax benefits and
payables are as follows:
As described in Note 1 Summary of Significant Accounting Policies, the Company has presented deferred income taxes
as noncurrent as of December 31, 2015.
The change in deferred tax balance was primarily attributable to deferred tax liabilities for intangible assets that were
recorded in connection with the acquisition of Elster. Our gross deferred tax asset includes $1,049 million related to non-
U.S. operations comprised principally of deductible temporary differences and net operating loss, capital loss and tax credit
carryforwards (mainly in Canada, France, Luxembourg and the United Kingdom). We maintain a valuation allowance of
$587 million against a portion of the non-U.S. gross deferred tax assets. The change in the valuation allowance resulted in
an increase of $114 million, decrease of $10 million and increase of $49 million to income tax expense in 2015, 2014 and
2013. In the event we determine that we will not be able to realize our net deferred tax assets in the future, we will reduce
such amounts through an increase to income tax expense in the period such determination is made. Conversely, if we
determine that we will be able to realize net deferred tax assets in excess of the carrying amounts, we will decrease the
recorded valuation allowance through a reduction to income tax expense in the period that such determination is made.
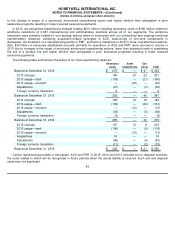
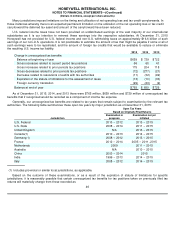
As of December 31, 2015, our net operating loss, capital loss and tax credit carryforwards were as follows:
45
Deferred tax assets:
December 31,
2015
2014
Pension
$
500
$
573
Postretirement benefits other than pensions
292
441
Asbestos and environmental
473
477
Employee compensation and benefits
387
387
Other accruals and reserves
626
672
Net operating and capital losses
620
639
Tax credit carryforwards
198
199
Gross deferred tax assets
3,096
3,388
Valuation allowance
(589
)
(560
)
Total deferred tax assets
$
2,507
$
2,828
Deferred tax liabilities:
Property, plant and equipment
$
(661
)
$
(612
)
Intangibles
(1,797
)
(1,060
)
Other asset basis differences
(293
)
(286
)
Other
(31
)
(7
)
Total deferred tax liabilities
(2,782
)
(1,965
)
Net deferred tax (liability) asset
$
(275
)
$
863
Jurisdiction
Expiration
Period
Net Operating
and Capital Loss
Carryforwards
Tax Credit
Carryforwards
U.S. Federal
2032
$
2
$
45
U.S. State
2034
1,315
25
Non
-
U.S.
2035
517
131
Non
-
U.S.
Indefinite
2,339
—
$
4,173
$
201