Honeywell 2015 Annual Report Download - page 25
Download and view the complete annual report
Please find page 25 of the 2015 Honeywell annual report below. You can navigate through the pages in the report by either clicking on the pages listed below, or by using the keyword search tool below to find specific information within the annual report.-
 1
1 -
2
-
3
-
4
-
5
-
6
-
7
-
8
-
9
-
10
-
11
-
12
-
13
-
14
-
 15
15 -
 16
16 -
 17
17 -
 18
18 -
 19
19 -
 20
20 -
 21
21 -
 22
22 -
 23
23 -
 24
24 -
 25
25 -
 26
26 -
 27
27 -
 28
28 -
 29
29 -
 30
30 -
 31
31 -
 32
32 -
 33
33 -
 34
34 -
 35
35 -
36
-
37
-
38
-
39
-
40
-
41
-
42
-
43
-
44
-
45
-
46
-
47
-
48
-
49
-
50
-
51
-
52
-
53
-
54
-
55
-
56
-
57
-
58
-
59
-
60
-
61
-
62
-
63
-
64
-
65
-
66
-
67
-
68
-
69
-
70
-
71
-
72
-
73
-
74
-
75
-
76
-
77
-
78
-
79
-
80
-
81
-
82
-
83
-
84
-
85
-
86
-
87
-
88
-
89
-
90
-
91
-
92
-
93
-
94
-
95
-
96
-
97
-
98
-
99
-
100
-
101
-
102
-
103
-
104
-
105
-
106
-
107
-
108
-
109
-
110
 |
 |

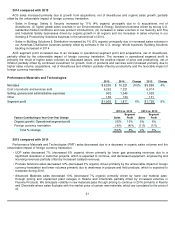
PMT segment profit increased due to an increase in operational segment profit partially offset by the unfavorable impact
of foreign currency translation. The increase in operational segment profit is primarily due to price and productivity net of
inflation partially offset by lower organic sales volumes and continued investments for growth. Cost of products and services
sold decreased primarily due to the favorable impacts of inflation, foreign currency translation, lower organic sales volumes
and productivity, partially offset by continued investments for growth.
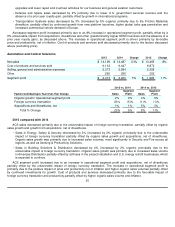
2014 compared with 2013
PMT sales increased due to an increase in organic sales partially offset by the unfavorable impact of foreign currency
translation.
PMT segment profit increased due to an increase in operational segment profit partially offset by the unfavorable impact
of foreign currency translation. The increase in operational segment profit is primarily due to higher sales volumes, as
discussed above, and productivity, net of inflation partially offset by unfavorable Advanced Materials pricing, continued
investment for growth and unfavorable foreign currency translation. Cost of products and services sold increased primarily
due to higher volume and continued investment for growth partially offset by productivity, net of inflation and the favorable
impact of foreign currency translation.
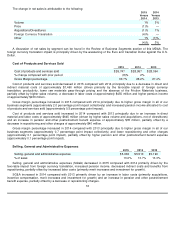
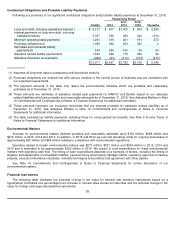
Repositioning Charges
See Note 3 Repositioning and Other Charges of Notes to Financial Statements for a discussion of our repositioning
actions and related charges incurred in 2015, 2014 and 2013. These repositioning actions are expected to generate
incremental pretax savings of $175 million to $200 million in 2016 compared with 2015 principally from planned workforce
reductions. Cash spending related to our repositioning actions was $118 million, $161 million and $160 million in 2015, 2014
and 2013, and was funded through operating cash flows. In 2016, we expect cash spending for repositioning actions to be
approximately $175 million and to be funded through operating cash flows.
22
•
UOP sales increased by 8% driven primarily by higher catalyst and gas processing volumes partially offset by lower
equipment and service revenues in the first nine months. Catalyst sales decreased in the fourth quarter due to the
timing of shipments as well as stronger volume growth in the fourth quarter of 2013 as compared to 2014 which was
partially offset by increased licensing revenues.
•
Sales in our Process Solutions business increased by 1% (4% organic) driven primarily by volume growth in advanced
solutions software and services and field products partially offset by unfavorable foreign currency translation,
predominately in the fourth quarter. Project and service orders and backlog increased in 2014.
•
Advanced Materials sales increased by 3% primarily driven by increased volume in Fluorine Products and Resins and
Chemicals, partially offset by unfavorable pricing most significantly in Fluorine Products and lower raw materials pass-
through pricing in Resins and Chemicals. We anticipate lower raw materials pass-through pricing to continue in 2015
primarily in Resins and Chemicals where sales fluctuate with the market price of certain raw materials, which are
correlated to the price of oil.