Honeywell 2014 Annual Report Download - page 87
Download and view the complete annual report
Please find page 87 of the 2014 Honeywell annual report below. You can navigate through the pages in the report by either clicking on the pages listed below, or by using the keyword search tool below to find specific information within the annual report.-
 1
1 -
2
-
3
-
4
-
5
-
6
-
7
-
8
-
9
-
10
-
11
-
12
-
13
-
14
-
15
-
16
-
17
-
18
-
19
-
20
-
21
-
22
-
23
-
24
-
25
-
26
-
27
-
28
-
29
-
30
-
31
-
32
-
33
-
34
-
35
-
36
-
37
-
38
-
39
-
40
-
41
-
42
-
43
-
44
-
45
-
46
-
47
-
48
-
49
-
50
-
51
-
52
-
53
-
54
-
55
-
56
-
57
-
58
-
59
-
60
-
61
-
62
-
63
-
64
-
65
-
66
-
67
-
68
-
69
-
70
-
71
-
72
-
73
-
74
-
75
-
76
-
 77
77 -
 78
78 -
 79
79 -
 80
80 -
 81
81 -
 82
82 -
 83
83 -
 84
84 -
 85
85 -
 86
86 -
 87
87 -
 88
88 -
 89
89 -
 90
90 -
 91
91 -
 92
92 -
 93
93 -
 94
94 -
 95
95 -
 96
96 -
 97
97 -
98
-
99
-
100
-
101
 |
 |

2014 2013 2012
Years Ended December 31,
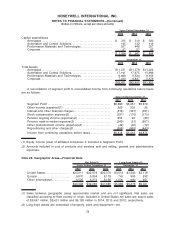
Capital expenditures
Aerospace . . . . . . . . . . . . . . . . . . . . . . . . . . . . . . . . . . . . . . . . . . . . . . . . . . . . $ 315 $ 310 $ 320
Automation and Control Solutions . . . . . . . . . . . . . . . . . . . . . . . . . . . . . . 145 132 114
Performance Materials and Technologies . . . . . . . . . . . . . . . . . . . . . . . 537 448 357
Corporate. . . . . . . . . . . . . . . . . . . . . . . . . . . . . . . . . . . . . . . . . . . . . . . . . . . . . 97 57 93
$ 1,094 $ 947 $ 884
2014 2013 2012
December 31,
Total Assets
Aerospace . . . . . . . . . . . . . . . . . . . . . . . . . . . . . . . . . . . . . . . . . . . . . . . . . . . . $11,151 $11,379 $11,024
Automation and Control Solutions . . . . . . . . . . . . . . . . . . . . . . . . . . . . . . 17,191 17,675 15,996
Performance Materials and Technologies . . . . . . . . . . . . . . . . . . . . . . . 9,699 9,534 9,154
Corporate. . . . . . . . . . . . . . . . . . . . . . . . . . . . . . . . . . . . . . . . . . . . . . . . . . . . . 7,410 6,847 5,679
$45,451 $45,435 $41,853
A reconciliation of segment profit to consolidated income from continuing operations before taxes
are as follows:
2014 2013 2012
Years Ended December 31,
Segment Profit . . . . . . . . . . . . . . . . . . . . . . . . . . . . . . . . . . . . . . . . . . . . . . $6,696 $6,351 $5,879
Other income (expense)(1). . . . . . . . . . . . . . . . . . . . . . . . . . . . . . . . . . . 269 202 25
Interest and other financial charges. . . . . . . . . . . . . . . . . . . . . . . . . . . (318) (327) (351)
Stock compensation expense(2) . . . . . . . . . . . . . . . . . . . . . . . . . . . . . . (187) (170) (170)
Pension ongoing income (expense)(2) . . . . . . . . . . . . . . . . . . . . . . . . 254 90 (36)
Pension mark-to-market expense(2) . . . . . . . . . . . . . . . . . . . . . . . . . . (249) (51) (957)
Other postretirement income (expense)(2) . . . . . . . . . . . . . . . . . . . . (49) (20) (72)
Repositioning and other charges(2) . . . . . . . . . . . . . . . . . . . . . . . . . . . (598) (663) (443)
Income from continuing operations before taxes. . . . . . . . . . . . . . . $5,818 $5,412 $3,875
(1) Equity income (loss) of affiliated companies is included in Segment Profit.
(2) Amounts included in cost of products and services sold and selling, general and administrative
expenses.
Note 22. Geographic Areas—Financial Data
Years Ended December 31, December 31,
Net Sales(1) Long-lived Assets(2)
2014 2013 2012 2014 2013 2012
United States . . . . . . . . . . . . . . . . . . $23,911 $22,978 $22,379 $3,612 $3,393 $3,118
Europe . . . . . . . . . . . . . . . . . . . . . . . . 9,870 9,804 9,118 741 905 932
Other International . . . . . . . . . . . . . 6,525 6,273 6,168 1,030 980 951
$40,306 $39,055 $37,665 $5,383 $5,278 $5,001
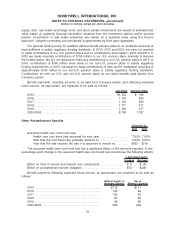
(1) Sales between geographic areas approximate market and are not significant. Net sales are
classified according to their country of origin. Included in United States net sales are export sales
of $5,647 million, $5,431 million and $5,126 million in 2014, 2013 and 2012, respectively.
(2) Long-lived assets are comprised of property, plant and equipment—net.
78
HONEYWELL INTERNATIONAL INC.
NOTES TO FINANCIAL STATEMENTS—(Continued)
(Dollars in millions, except per share amounts)