Honeywell 2014 Annual Report Download - page 31
Download and view the complete annual report
Please find page 31 of the 2014 Honeywell annual report below. You can navigate through the pages in the report by either clicking on the pages listed below, or by using the keyword search tool below to find specific information within the annual report.-
 1
1 -
2
-
3
-
4
-
5
-
6
-
7
-
8
-
9
-
10
-
11
-
12
-
13
-
14
-
15
-
16
-
17
-
18
-
19
-
20
-
 21
21 -
 22
22 -
 23
23 -
 24
24 -
 25
25 -
 26
26 -
 27
27 -
 28
28 -
 29
29 -
 30
30 -
 31
31 -
 32
32 -
 33
33 -
 34
34 -
 35
35 -
 36
36 -
 37
37 -
 38
38 -
 39
39 -
 40
40 -
 41
41 -
42
-
43
-
44
-
45
-
46
-
47
-
48
-
49
-
50
-
51
-
52
-
53
-
54
-
55
-
56
-
57
-
58
-
59
-
60
-
61
-
62
-
63
-
64
-
65
-
66
-
67
-
68
-
69
-
70
-
71
-
72
-
73
-
74
-
75
-
76
-
77
-
78
-
79
-
80
-
81
-
82
-
83
-
84
-
85
-
86
-
87
-
88
-
89
-
90
-
91
-
92
-
93
-
94
-
95
-
96
-
97
-
98
-
99
-
100
-
101
 |
 |

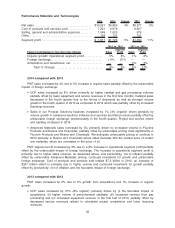
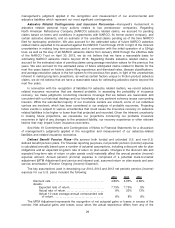
Performance Materials and Technologies
2014 2013 Change 2012 Change
Net sales . . . . . . . . . . . . . . . . . . . . . . . . . . . . . . . . . . . . . . . . . . $10,221 $9,855 4% $9,277 6%
Cost of products and services sold . . . . . . . . . . . . . . . . . 7,221 6,974 6,627
Selling, general and administrative expenses . . . . . . . . 1,049 1,025 979
Other . . . . . . . . . . . . . . . . . . . . . . . . . . . . . . . . . . . . . . . . . . . . . . 134 131 121
Segment profit . . . . . . . . . . . . . . . . . . . . . . . . . . . . . . . . . . . . . $ 1,817 $1,725 5% $1,550 11%
Factors Contributing to Year-Over-Year Change Sales
Segment
Profit Sales
Segment
Profit
2014 vs. 2013 2013 vs. 2012
Organic growth/ Operational segment profit . . . . . . . . . . . . . 5% 6% 1% 6%
Foreign exchange . . . . . . . . . . . . . . . . . . . . . . . . . . . . . . . . . . . . . . (1)% (1)% — —
Acquisitions and divestitures, net . . . . . . . . . . . . . . . . . . . . . . . — — 5% 5%
Total % Change . . . . . . . . . . . . . . . . . . . . . . . . . . . . . . . . . . . 4% 5% 6% 11%
2014 compared with 2013
PMT sales increased by 4% due to 5% increase in organic sales partially offset by the unfavorable
impact of foreign exchange.
•UOP sales increased by 8% driven primarily by higher catalyst and gas processing volumes
partially offset by lower equipment and service revenues in the first nine months. Catalyst sales
decreased in the fourth quarter due to the timing of shipments as well as stronger volume
growth in the fourth quarter of 2013 as compared to 2014 which was partially offset by increased
licensing revenues.
•Sales in our Process Solutions business increased by 1% (4% organic) driven primarily by
volume growth in advanced solutions software and services and field products partially offset by
unfavorable foreign exchange, predominately in the fourth quarter. Project and service orders
and backlog increased in 2014.
•Advanced Materials sales increased by 3% primarily driven by increased volume in Fluorine
Products and Resins and Chemicals, partially offset by unfavorable pricing most significantly in
Fluorine Products and Resins and Chemicals. We anticipate unfavorable pricing to continue in
2015 primarily in Resins and Chemicals where sales fluctuate with the market price of certain
raw materials, which are correlated to the price of oil.
PMT segment profit increased by 5% due to a 6% increase in operational segment profit partially
offset by the unfavorable impact of foreign exchange. The increase in operational segment profit is
primarily due to higher sales volumes, as discussed above, and productivity, net of inflation partially
offset by unfavorable Advanced Materials pricing, continued investment for growth and unfavorable
foreign exchange. Cost of products and services sold totaled $7.2 billion in 2014, an increase of
$247 million which is primarily due to higher volume and continued investment for growth partially
offset by productivity, net of inflation and the favorable impact of foreign exchange.
2013 compared with 2012
PMT sales increased by 6% due to 5% growth from acquisitions and 1% increase in organic
growth.
•UOP sales increased by 31% (9% organic) primarily driven by (i) the favorable impact of
acquisitions, (ii) higher volume of petrochemical catalysts, (iii) increased revenue from gas
processing and (iv) increased equipment revenue in the first half of 2013, partially offset by
decreased service revenues related to scheduled project completions and lower licensing
revenues.
22