Honeywell 2014 Annual Report Download - page 86
Download and view the complete annual report
Please find page 86 of the 2014 Honeywell annual report below. You can navigate through the pages in the report by either clicking on the pages listed below, or by using the keyword search tool below to find specific information within the annual report.-
 1
1 -
2
-
3
-
4
-
5
-
6
-
7
-
8
-
9
-
10
-
11
-
12
-
13
-
14
-
15
-
16
-
17
-
18
-
19
-
20
-
21
-
22
-
23
-
24
-
25
-
26
-
27
-
28
-
29
-
30
-
31
-
32
-
33
-
34
-
35
-
36
-
37
-
38
-
39
-
40
-
41
-
42
-
43
-
44
-
45
-
46
-
47
-
48
-
49
-
50
-
51
-
52
-
53
-
54
-
55
-
56
-
57
-
58
-
59
-
60
-
61
-
62
-
63
-
64
-
65
-
66
-
67
-
68
-
69
-
70
-
71
-
72
-
73
-
74
-
75
-
 76
76 -
 77
77 -
 78
78 -
 79
79 -
 80
80 -
 81
81 -
 82
82 -
 83
83 -
 84
84 -
 85
85 -
 86
86 -
 87
87 -
 88
88 -
 89
89 -
 90
90 -
 91
91 -
 92
92 -
 93
93 -
 94
94 -
 95
95 -
 96
96 -
97
-
98
-
99
-
100
-
101
 |
 |

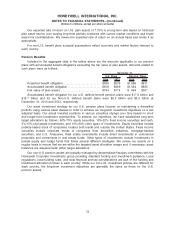
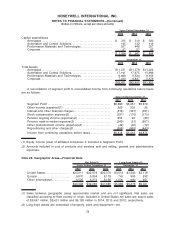
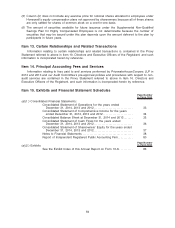
Note 21. Segment Financial Data
We globally manage our business operations through three reportable operating segments.
Segment information is consistent with how management reviews the businesses, makes investing and
resource allocation decisions and assesses operating performance.
Honeywell’s senior management evaluates segment performance based on segment profit.
Segment profit is measured as business unit income (loss) before taxes excluding general corporate
unallocated expense, other income (expense), interest and other financial charges, pension and other
postretirement benefits (expense), stock compensation expense, repositioning and other charges and
accounting changes.
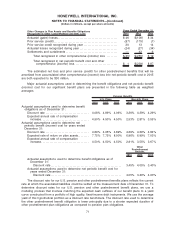
In April 2014, the Company announced the realignment of our Honeywell Process Solutions
business from Automation and Control Solutions into Performance Materials and Technologies. The
Company has reported its financial performance based on the inclusion of Honeywell Process
Solutions in Performance Materials and Technologies for all periods presented.
In July 2014, following the closing of the sale of its Friction Materials business, the Company
announced the realignment of its Transportation Systems business segment with its Aerospace
business segment. Under the realigned segment reporting structure, the Company has three business
segments: Aerospace, Automation and Control Solutions and Performance Materials and Technolo-
gies. The Company has reported its financial performance based on the inclusion of Transportation
Systems in Aerospace for all periods presented.
These realignments have no impact on the Company’s historical consolidated financial position,
results of operations, or cash flows.
2014 2013 2012
Years Ended December 31,
Net Sales
Aerospace
Product. . . . . . . . . . . . . . . . . . . . . . . . . . . . . . . . . . . . . . . . . . . . . . . . . . . . . . . $10,773 $10,798 $10,560
Service . . . . . . . . . . . . . . . . . . . . . . . . . . . . . . . . . . . . . . . . . . . . . . . . . . . . . . . 4,825 4,937 5,041
Total . . . . . . . . . . . . . . . . . . . . . . . . . . . . . . . . . . . . . . . . . . . . . . . . . . . . . 15,598 15,735 15,601
Automation and Control Solutions
Product. . . . . . . . . . . . . . . . . . . . . . . . . . . . . . . . . . . . . . . . . . . . . . . . . . . . . . . 13,219 12,253 11,581
Service . . . . . . . . . . . . . . . . . . . . . . . . . . . . . . . . . . . . . . . . . . . . . . . . . . . . . . . 1,268 1,212 1,206
Total . . . . . . . . . . . . . . . . . . . . . . . . . . . . . . . . . . . . . . . . . . . . . . . . . . . . . 14,487 13,465 12,787
Performance Materials and Technologies
Product. . . . . . . . . . . . . . . . . . . . . . . . . . . . . . . . . . . . . . . . . . . . . . . . . . . . . . . 8,406 8,163 7,671
Service . . . . . . . . . . . . . . . . . . . . . . . . . . . . . . . . . . . . . . . . . . . . . . . . . . . . . . . 1,815 1,692 1,606
Total . . . . . . . . . . . . . . . . . . . . . . . . . . . . . . . . . . . . . . . . . . . . . . . . . . . . . 10,221 9,855 9,277
$40,306 $39,055 $37,665
Depreciation and amortization
Aerospace . . . . . . . . . . . . . . . . . . . . . . . . . . . . . . . . . . . . . . . . . . . . . . . . . . . . $ 277 $ 290 $ 296
Automation and Control Solutions . . . . . . . . . . . . . . . . . . . . . . . . . . . . . . 306 302 302
Performance Materials and Technologies . . . . . . . . . . . . . . . . . . . . . . . 284 336 265
Corporate. . . . . . . . . . . . . . . . . . . . . . . . . . . . . . . . . . . . . . . . . . . . . . . . . . . . . 57 61 63
$ 924 $ 989 $ 926
Segment Profit
Aerospace . . . . . . . . . . . . . . . . . . . . . . . . . . . . . . . . . . . . . . . . . . . . . . . . . . . . $ 2,915 $ 2,870 $ 2,711
Automation and Control Solutions . . . . . . . . . . . . . . . . . . . . . . . . . . . . . . 2,200 1,983 1,836
Performance Materials and Technologies . . . . . . . . . . . . . . . . . . . . . . . 1,817 1,725 1,550
Corporate. . . . . . . . . . . . . . . . . . . . . . . . . . . . . . . . . . . . . . . . . . . . . . . . . . . . . (236) (227) (218)
$ 6,696 $ 6,351 $ 5,879
77
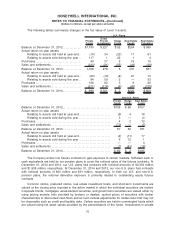
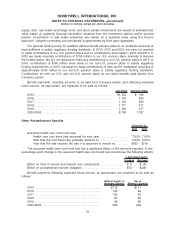
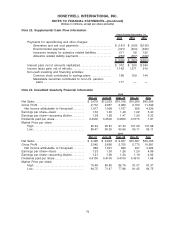
HONEYWELL INTERNATIONAL INC.
NOTES TO FINANCIAL STATEMENTS—(Continued)
(Dollars in millions, except per share amounts)