Honeywell 2014 Annual Report Download - page 26
Download and view the complete annual report
Please find page 26 of the 2014 Honeywell annual report below. You can navigate through the pages in the report by either clicking on the pages listed below, or by using the keyword search tool below to find specific information within the annual report.-
 1
1 -
2
-
3
-
4
-
5
-
6
-
7
-
8
-
9
-
10
-
11
-
12
-
13
-
14
-
15
-
 16
16 -
 17
17 -
 18
18 -
 19
19 -
 20
20 -
 21
21 -
 22
22 -
 23
23 -
 24
24 -
 25
25 -
 26
26 -
 27
27 -
 28
28 -
 29
29 -
 30
30 -
 31
31 -
 32
32 -
 33
33 -
 34
34 -
 35
35 -
 36
36 -
37
-
38
-
39
-
40
-
41
-
42
-
43
-
44
-
45
-
46
-
47
-
48
-
49
-
50
-
51
-
52
-
53
-
54
-
55
-
56
-
57
-
58
-
59
-
60
-
61
-
62
-
63
-
64
-
65
-
66
-
67
-
68
-
69
-
70
-
71
-
72
-
73
-
74
-
75
-
76
-
77
-
78
-
79
-
80
-
81
-
82
-
83
-
84
-
85
-
86
-
87
-
88
-
89
-
90
-
91
-
92
-
93
-
94
-
95
-
96
-
97
-
98
-
99
-
100
-
101
 |
 |

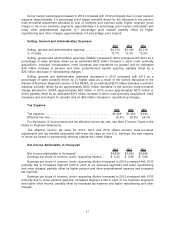
Gross margin percentage increased in 2013 compared with 2012 principally due to lower pension
expense (approximately 2.0 percentage point impact primarily driven by the decrease in the pension
mark-to-market adjustment allocated to cost of products and services sold), higher segment gross
margin in all of our business segments (approximately 0.5 percentage point impact collectively) and
lower other postretirement expense (0.1 percentage point impact) partially offset by higher
repositioning and other charges (approximately 0.4 percentage point impact).
Selling, General and Administrative Expenses
2014 2013 2012
Selling, general and administrative expense. . . . . . . . . . . . . . . . $5,518 $5,190 $5,218
% of sales . . . . . . . . . . . . . . . . . . . . . . . . . . . . . . . . . . . . . . . . . . . . . . . 13.7% 13.3% 13.9%
Selling, general and administrative expenses (SG&A) increased in 2014 compared with 2013 as a
percentage of sales primarily driven by an estimated $435 million increase in labor costs (primarily
acquisitions, incentive compensation, merit increases and investment for growth) and an estimated
$30 million increase in pension and other postretirement benefit expense, partially offset by a
$25 million decrease in repositioning charges.
Selling, general and administrative expenses decreased in 2013 compared with 2012 as a
percentage of sales primarily driven by (i) higher sales as a result of the factors discussed in the
Review of Business Segments section of this MD&A, (ii) an estimated $270 million decrease in pension
expense primarily driven by an approximately $250 million decrease in the pension mark-to-market
charge allocated to SG&A (approximately $20 million in 2013 versus approximately $270 million in
2012) partially offset by an estimated $215 million increase in labor costs (primarily acquisitions, merit
increases and investment for growth) and an $80 million increase in repositioning charges.
Tax Expense
2014 2013 2012
Tax expense . . . . . . . . . . . . . . . . . . . . . . . . . . . . . . . . . . . . . . . . . . . . . . $1,489 $1,450 $ 944
Effective tax rate . . . . . . . . . . . . . . . . . . . . . . . . . . . . . . . . . . . . . . . . . . 25.6% 26.8% 24.4%
For discussion of income taxes and the effective income tax rate, see Note 5 Income Taxes in the
Notes to Financial Statements.
The effective income tax rates for 2014, 2013 and 2012 reflect pension mark-to-market
adjustments and tax benefits associated with lower tax rates on non-U.S. earnings, the vast majority
of which we intend to permanently reinvest outside the United States.
Net Income Attributable to Honeywell
2014 2013 2012
Net income attributable to Honeywell . . . . . . . . . . . . . . . . . . . . . . $4,239 $3,924 $2,926
Earnings per share of common stock—assuming dilution . . . $ 5.33 $ 4.92 $ 3.69
Earnings per share of common stock—assuming dilution increased in 2014 compared with 2013
primarily due to increased segment profit in each of our business segments and lower repositioning
and other charges, partially offset by higher pension and other postretirement expense and increased
tax expense.
Earnings per share of common stock—assuming dilution increased in 2013 compared with 2012
primarily due to lower pension expense, increased segment profit in each of our business segments
and higher other income, partially offset by increased tax expense and higher repositioning and other
charges.
17