Honeywell 2014 Annual Report Download - page 6
Download and view the complete annual report
Please find page 6 of the 2014 Honeywell annual report below. You can navigate through the pages in the report by either clicking on the pages listed below, or by using the keyword search tool below to find specific information within the annual report.-
 1
1 -
 2
2 -
 3
3 -
 4
4 -
 5
5 -
 6
6 -
 7
7 -
 8
8 -
 9
9 -
 10
10 -
 11
11 -
 12
12 -
 13
13 -
 14
14 -
 15
15 -
 16
16 -
 17
17 -
18
-
19
-
20
-
21
-
22
-
23
-
24
-
25
-
26
-
27
-
28
-
29
-
30
-
31
-
32
-
33
-
34
-
35
-
36
-
37
-
38
-
39
-
40
-
41
-
42
-
43
-
44
-
45
-
46
-
47
-
48
-
49
-
50
-
51
-
52
-
53
-
54
-
55
-
56
-
57
-
58
-
59
-
60
-
61
-
62
-
63
-
64
-
65
-
66
-
67
-
68
-
69
-
70
-
71
-
72
-
73
-
74
-
75
-
76
-
77
-
78
-
79
-
80
-
81
-
82
-
83
-
84
-
85
-
86
-
87
-
88
-
89
-
90
-
91
-
92
-
93
-
94
-
95
-
96
-
97
-
98
-
99
-
100
-
101
 |
 |

Notes to Shareowners Letter:
1) Reconciliation of EPS to EPS, Excluding Pension Mark-to-Market Adjustment
2013(a) 2014(b)
EPS. ................................................................. $4.92 $5.33
Pension Mark-to-Market Adjustment . . . ................................ 0.05 0.23
EPS—Excluding Pension Mark-to-Market Adjustment . .................. $4.97 $5.56
(a) EPS utilizes weighted average shares of 797.3 million and mark-to-market uses a
blended tax rate of 25.5%.
(b) EPS utilizes weighted average shares of 795.2 million and mark-to-market uses a
blended tax rate of 28.1%.
2) Reconciliation of Segment Profit to Operating Income Excluding Pension Mark-to-Market
Adjustment and Calculation of Segment Profit and Operating Income Margin Excluding
Pension Mark-to-Market Adjustment
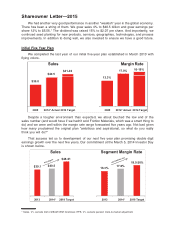
($M) 2009 2013 2014
Segment Profit. ...................................... $ 3,991 $ 6,351 $ 6,696
Stock Based Compensation (a) ........................ (117) (170) (187)
Repositioning and Other (a,b) .......................... (493) (699) (634)
Pension Ongoing (Expense) Income (a)................ (287) 90 254
Pension Mark-to-Market Adjustment (a) ................ (741) (51) (249)
OPEB Income (Expense) (a) .......................... 15 (20) (49)
Operating Income. . .................................. $ 2,368 $ 5,501 $ 5,831
Pension Mark-to-Market Adjustment (a) ................ (741) (51) (249)
Operating Income Excluding Pension Mark-to-Market
Adjustment ........................................ $ 3,109 $ 5,552 $ 6,080
Segment Profit. ...................................... $ 3,991 $ 6,351 $ 6,696
÷Sales ............................................. $29,951 $39,055 $40,306
Segment Profit Margin % . ........................... 13.3% 16.3% 16.6%
Operating Income. . .................................. $ 2,368 $ 5,501 $ 5,831
÷Sales ............................................. $29,951 $39,055 $40,306
Operating Income Margin %.......................... 7.9% 14.1% 14.5%
Operating Income Excluding Pension Mark-to-Market
Adjustment ........................................ $ 3,109 $ 5,552 $ 6,080
÷Sales ............................................. $29,951 $39,055 $40,306
Operating Income Margin Excluding Pension Mark-to-
Market Adjustment................................. 10.4% 14.2% 15.1%
(a) Included in cost of products and services sold and selling, general and administrative
expenses
(b) Includes repositioning, asbestos, environmental expenses and equity income adjustment
This letter contains certain statements that may be deemed “forward-looking statements”
within the meaning of Section 21E of the Securities Exchange Act of 1934. All statements,
other than statements of historical fact, that address activities, events or developments that
we or our management intends, expects, projects, believes or anticipates will or may occur in