Honeywell 2014 Annual Report Download - page 51
Download and view the complete annual report
Please find page 51 of the 2014 Honeywell annual report below. You can navigate through the pages in the report by either clicking on the pages listed below, or by using the keyword search tool below to find specific information within the annual report.-
 1
1 -
2
-
3
-
4
-
5
-
6
-
7
-
8
-
9
-
10
-
11
-
12
-
13
-
14
-
15
-
16
-
17
-
18
-
19
-
20
-
21
-
22
-
23
-
24
-
25
-
26
-
27
-
28
-
29
-
30
-
31
-
32
-
33
-
34
-
35
-
36
-
37
-
38
-
39
-
40
-
 41
41 -
 42
42 -
 43
43 -
 44
44 -
 45
45 -
 46
46 -
 47
47 -
 48
48 -
 49
49 -
 50
50 -
 51
51 -
 52
52 -
 53
53 -
 54
54 -
 55
55 -
 56
56 -
 57
57 -
 58
58 -
 59
59 -
 60
60 -
 61
61 -
62
-
63
-
64
-
65
-
66
-
67
-
68
-
69
-
70
-
71
-
72
-
73
-
74
-
75
-
76
-
77
-
78
-
79
-
80
-
81
-
82
-
83
-
84
-
85
-
86
-
87
-
88
-
89
-
90
-
91
-
92
-
93
-
94
-
95
-
96
-
97
-
98
-
99
-
100
-
101
 |
 |

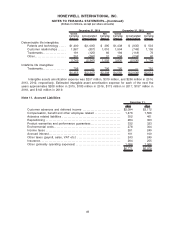
organizational realignments of businesses in our ACS and PMT segments. Also, $38 million of
previously established accruals, primarily for severance, mainly in our Aerospace and ACS segment
were returned to income in 2014 due principally to the change in scope of a previously announced
repositioning action and to fewer employee severance actions caused by higher attrition than originally
planned associated with prior severance programs.
In 2013, we recognized repositioning charges totaling $231 million including severance costs of
$186 million related to workforce reductions of 3,081 manufacturing and administrative positions across
all of our segments. The workforce reductions were primarily related to cost savings actions taken in
connection with our productivity and ongoing functional transformation initiatives, achieving acquisition-
related synergies in our ACS segment, outsourcing of non-core components in our Aerospace
segment, the shutdown of a manufacturing facility in our PMT segment, and factory transitions in our
ACS segment to more cost-effective locations. Also, $30 million of previously established accruals,
primarily for severance, in our ACS and PMT segments were returned to income in 2013 due to
changes in the scope of previously announced repositioning actions, lower than expected costs in
completing the exit of a product line and fewer employee severance actions caused by higher attrition
than originally planned associated with prior severance programs.
In 2012, we recognized repositioning charges totaling $119 million including severance costs of
$91 million related to workforce reductions of 2,204 manufacturing and administrative positions across
all of our segments. The workforce reductions were primarily related to the planned shutdown of a
manufacturing facility in our Aerospace segment, the exit from a product line in our PMT segment, and
cost savings actions taken in connection with our productivity and ongoing functional transformation
initiatives. Also, $66 million of previously established accruals, primarily for severance, in our ACS,
Aerospace and PMT segments were returned to income in 2012 due primarily to fewer employee
severance actions caused by higher attrition than originally planned associated with prior severance
programs and changes in the scope of previously announced repositioning actions.
The following table summarizes the status of our total repositioning reserves:
Severance
Costs
Asset
Impairments
Exit
Costs Total
Balance at December 31, 2011 . . . . . . . . . . . . . . . . . . . $ 353 $ — $ 59 $ 412
2012 charges . . . . . . . . . . . . . . . . . . . . . . . . . . . . . . . . . . 91 12 16 119
2012 usage—cash . . . . . . . . . . . . . . . . . . . . . . . . . . . . . (113) — (23) (136)
2012 usage—noncash . . . . . . . . . . . . . . . . . . . . . . . . . . — (12) — (12)
Adjustments. . . . . . . . . . . . . . . . . . . . . . . . . . . . . . . . . . . . (61) — (5) (66)
Foreign currency translation. . . . . . . . . . . . . . . . . . . . . 6 — — 6
Balance at December 31, 2012 . . . . . . . . . . . . . . . . . . . 276 — 47 323
2013 charges . . . . . . . . . . . . . . . . . . . . . . . . . . . . . . . . . . 186 23 22 231
2013 usage—cash . . . . . . . . . . . . . . . . . . . . . . . . . . . . . (139) — (21) (160)
2013 usage—noncash . . . . . . . . . . . . . . . . . . . . . . . . . . — (23) — (23)
Adjustments. . . . . . . . . . . . . . . . . . . . . . . . . . . . . . . . . . . . (27) — (3) (30)
Foreign currency translation. . . . . . . . . . . . . . . . . . . . . 6 — — 6
Balance at December 31, 2013 . . . . . . . . . . . . . . . . . . . 302 — 45 347
2014 charges . . . . . . . . . . . . . . . . . . . . . . . . . . . . . . . . . . 156 12 16 184
2014 usage—cash . . . . . . . . . . . . . . . . . . . . . . . . . . . . . (135) — (26) (161)
2014 usage—noncash . . . . . . . . . . . . . . . . . . . . . . . . . . — (12) — (12)
Adjustments. . . . . . . . . . . . . . . . . . . . . . . . . . . . . . . . . . . . (33) — (5) (38)
Foreign currency translation. . . . . . . . . . . . . . . . . . . . . (5) — — (5)
Balance at December 31, 2014 . . . . . . . . . . . . . . . . . . . $ 285 $ — $ 30 $ 315
42
HONEYWELL INTERNATIONAL INC.
NOTES TO FINANCIAL STATEMENTS—(Continued)
(Dollars in millions, except per share amounts)