Honda 2015 Annual Report Download - page 42
Download and view the complete annual report
Please find page 42 of the 2015 Honda annual report below. You can navigate through the pages in the report by either clicking on the pages listed below, or by using the keyword search tool below to find specific information within the annual report.-
 1
1 -
2
-
3
-
4
-
5
-
6
-
7
-
8
-
9
-
10
-
11
-
12
-
13
-
14
-
15
-
16
-
17
-
18
-
19
-
20
-
21
-
22
-
23
-
24
-
25
-
26
-
27
-
28
-
29
-
30
-
31
-
 32
32 -
 33
33 -
 34
34 -
 35
35 -
 36
36 -
 37
37 -
 38
38 -
 39
39 -
 40
40 -
 41
41 -
 42
42 -
 43
43 -
 44
44 -
 45
45 -
 46
46
 |
 |

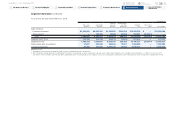
Unaudited Consolidated Statements of Cash Flows
Divided into Non-financial Services Businesses and Finance Subsidiaries
Fiscal years ended March 31, 2014 and 2015 Yen (millions)
2014 2015
Non-financial
Services
Businesses
Finance
Subsidiaries
Reconciling
Items Consolidated
Non-financial
Services
Businesses
Finance
Subsidiaries
Reconciling
Items Consolidated
Cash flows from operating activities:
Profit before income taxes ¥ 752,581 ¥ 181,322 ¥ — ¥ 933,903 ¥ 592,086 ¥ 214,151 ¥ —¥ 806,237
Depreciation, amortization and impairment losses excluding equipment
on operating leases 585,826 2,306 —588,132 622,238 2,991 —625,229
Share of profit of investments accounted for using the equity method (130,916) — — (130,916) (96,097) — — (96,097)
Decrease (increase) in trade receivables (51,301) (5,581) 9,798 (47,084) (55,694) 1,383 8,472 (45,839)
Decrease (increase) in inventories (66,233) (758) —(66,991) (55,882) (403) —(56,285)
Increase (decrease) in trade payables 91,845 (269) (7,056) 84,520 20,132 352 1,762 22,246
Decrease (increase) in receivables from financial services —(424,838) 1,732 (423,106) —317,033 (71) 316,962
Decrease (increase) in equipment on operating leases —(248,604) —(248,604) —(535,165) —(535,165)
Dividends received 107,627 2 — 107,629 114,499 2 — 114,501
Other, net (266,521) (79,408) (2,446) (348,375) (72,899) (48,238) (10,248) (131,385)
Net cash provided by (used in) operating activities 1,022,908 (575,828) 2,028 449,108 1,068,383 (47,894) (85) 1,020,404
Cash flows from investing activities:
Payments for additions to property, plant and equipment (717,958) (473) —(718,431) (647,773) (432) —(648,205)
Payments for additions to and internally developed intangible assets (205,286) (3,466) —(208,752) (231,280) (3,635) —(234,915)
Decrease (increase) in other financial assets* (32,541) (4,867) 4,327 (33,081) 145,452 (948) (133,480) 11,024
Other, net 35,654 3,587 —39,241 26,970 4,630 —31,600
Net cash provided by (used in) investing activities (920,131) (5,219) 4,327 (921,023) (706,631) (385) (133,480) (840,496)
Cash flows from financing activities:
Proceeds from (repayment of) short-term financing liabilities* (88,668) 73,965 7,756 (6,947) 54,692 (58,331) 133,358 129,719
Proceeds from long-term financing liabilities* 128,567 1,485,291 (16,328) 1,597,530 53,375 1,452,391 (34) 1,505,732
Repayments of long-term financing liabilities* (79,959) (981,493) 2,217 (1,059,235) (106,769) (1,282,593) 241 (1,389,121)
Dividends paid to owners of the parent (142,381) — — (142,381) (158,601) — — (158,601)
Other, net (33,509) — — (33,509) (75,241) — — (75,241)
Net cash provided by (used in) financing activities (215,950) 577,763 (6,355) 355,458 (232,544) 111,467 133,565 12,488
Effect of exchange rate changes on cash and cash equivalents 38,200 1,229 —39,429 77,335 8,415 —85,750
Net change in cash and cash equivalents (74,973) (2,055) —(77,028) 206,543 71,603 —278,146
Cash and cash equivalents at beginning of period 1,246,964 23,648 —1,270,612 1,171,991 21,593 —1,193,584
Cash and cash equivalents at end of period ¥1,171,991 ¥ 21,593 ¥ — ¥ 1,193,584 ¥1,378,534 ¥ 93,196 ¥ —¥ 1,471,730
Note: Non-financial services businesses provide loans to finance subsidiaries. These cash flows are included in the decrease (increase) in other financial assets, proceeds from (repayment of) short-term financing liabilities,
proceeds from and repayment of long-term financing liabilities (marked by *). The amount of the loans to finance subsidiaries is a ¥4,327 million increase for the fiscal year ended March 31, 2014, and a ¥133,480 million
decrease for the fiscal year ended March 31, 2015, respectively.
Honda Motor Co., Ltd. Annual Report 2015 41
6 Financial Section
1 The Power of Dreams
2 Financial Highlights
3 To Our Shareholders
4 Review of Operations
5 Corporate Governance
7
Investor Relations
Information
Return to last
page opened
Go to
contents page