Honda 2015 Annual Report Download - page 27
Download and view the complete annual report
Please find page 27 of the 2015 Honda annual report below. You can navigate through the pages in the report by either clicking on the pages listed below, or by using the keyword search tool below to find specific information within the annual report.-
 1
1 -
2
-
3
-
4
-
5
-
6
-
7
-
8
-
9
-
10
-
11
-
12
-
13
-
14
-
15
-
16
-
 17
17 -
 18
18 -
 19
19 -
 20
20 -
 21
21 -
 22
22 -
 23
23 -
 24
24 -
 25
25 -
 26
26 -
 27
27 -
 28
28 -
 29
29 -
 30
30 -
 31
31 -
 32
32 -
 33
33 -
 34
34 -
 35
35 -
 36
36 -
 37
37 -
38
-
39
-
40
-
41
-
42
-
43
-
44
-
45
-
46
 |
 |

approximately ¥257.8 billion, or 3.3%, compared to the increase as reported of
¥1,240.3 billion, which includes positive foreign currency translation effects.
Sales revenue from external customers increased by ¥229.5 billion, or 17.3%,
to ¥1,555.5 billion from the previous fiscal year, due mainly to an increase in
operating lease revenues and positive foreign currency translation effects. Honda
estimates that by applying Japanese yen exchange rates of the previous fiscal
year to the current fiscal year, sales revenue for the year would have increased by
approximately ¥106.5 billion, or 8.0%, compared to the increase as reported of
¥229.5 billion, which includes positive foreign currency translation effects. Sales
revenue including intersegment sales increased by ¥230.1 billion, or 17.2%, to
¥1,567.9 billion from the previous fiscal year.
Operating costs and expenses increased by ¥210.3 billion, or 18.2%, to
¥1,365.3 billion from the previous fiscal year. Cost of sales increased by ¥203.0
billion, or 19.0%, to ¥1,271.8 billion from the previous fiscal year, due mainly to an
increase in costs attributable to increased operating lease revenues and negative
foreign currency effects. Selling, general and administrative expenses increased by
¥7.2 billion, or 8.4%, to ¥93.4 billion from the previous fiscal year.
Operating profit increased by ¥19.8 billion, or 10.9%, to ¥202.5 billion from the
previous fiscal year, due mainly to increased sales revenue and positive foreign
currency effects.
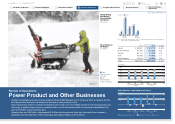
Power Product and Other Businesses
Honda’s consolidated unit sales of power products totaled 5,983 thousand units,
a decrease of 0.6% from the previous fiscal year, due mainly to a decrease in
consolidated unit sales in Asia, which was partially offset by an increase in Europe.
Sales revenue from external customers increased by ¥10.4 billion, or 3.4%, to
¥322.5 billion from the previous fiscal year, due mainly to positive foreign currency
translation effects, which was partially offset by a decrease in consolidated unit
sales in Power product business operations. Honda estimates that by applying
Japanese yen exchange rates of the previous fiscal year to the current fiscal year,
sales revenue for the year would have decreased by approximately ¥2.0 billion, or
0.7%, compared to the increase as reported of ¥10.4 billion, which includes posi-
tive foreign currency translation effects. Sales revenue including intersegment sales
increased by ¥9.0 billion, or 2.7%, to ¥346.9 billion from the previous fiscal year.
Operating costs and expenses increased by ¥16.0 billion, or 4.8%, to ¥350.7
billion from the previous fiscal year. Cost of sales increased by ¥13.9 billion, or
5.5%, to ¥265.4 billion, due mainly to negative foreign currency effects. Selling,
general and administrative expenses increased by ¥2.1 billion, or 4.1%, to ¥55.4
billion. Research and development expenses totaled to ¥29.9 billion, basically
unchanged from the previous fiscal year.
Operating loss was ¥3.8 billion, a decrease of ¥6.9 billion from the previous
fiscal year, due mainly to an increase in operating costs and expenses in Other
businesses and negative foreign currency effects.
Geographical Information
Japan
In Japan, sales revenue from domestic and export sales decreased by ¥282.7
billion, or 6.7%, to ¥3,930.9 billion from the previous fiscal year, due mainly to a
decrease in sales revenue in the Automobile business. Operating profit decreased
by ¥35.6 billion, or 14.5%, to ¥210.1 billion from the previous fiscal year, due
mainly to increased selling, general and administrative expenses, including product
warranty expenses, and a decrease in profit attributable to decreased sales revenue
and model mix, which was partially offset by positive foreign currency effects.
North America
In North America, which mainly consists of the United States, sales revenue
increased by ¥638.4 billion, or 9.7%, to ¥7,200.8 billion from the previous fiscal
year, due mainly to positive foreign currency translation effects, which was partially
offset by a decrease in sales revenue in the Automobile business. Operating profit
decreased by ¥154.1 billion, or 45.9%, to ¥181.5 billion from the previous fiscal
year, due mainly to increased selling, general and administrative expenses includ-
ing product warranty expenses and a decrease in profit attributable to decreased
sales revenue and model mix, which was partially offset by continuing cost reduc-
tion and positive foreign currency effects.
Europe
In Europe, sales revenue decreased by ¥57.6 billion, or 7.4%, to ¥723.9 billion
from the previous fiscal year, due mainly to a decrease in sales revenue in the
Automobile business, which was partially offset by an increase in sales revenue in
the Motorcycle business and positive foreign currency translation effects. Operating
loss was ¥22.6 billion, an improvement of ¥11.2 billion from the previous fiscal
year, due mainly to effect of impairment loss recognized in the previous fiscal year,
which was partially offset by negative foreign currency effects.
Asia
In Asia, sales revenue increased by ¥438.1 billion, or 15.2%, to ¥3,328.5 billion
from the previous fiscal year, due mainly to an increase in sales revenue in the
Automobile business and Motorcycle business and positive foreign currency trans-
lation effects. Operating profit increased by ¥46.8 billion, or 20.2%, to ¥278.8
billion from the previous fiscal year, due mainly to an increase in profit attributable
to increased sales revenue and model mix, continuing cost reduction and positive
foreign currency effects, which was partially offset by increased selling, general
and administrative expenses.
Honda Motor Co., Ltd. Annual Report 2015 26
6 Financial Section
1 The Power of Dreams
2 Financial Highlights
3 To Our Shareholders
4 Review of Operations
5 Corporate Governance
7
Investor Relations
Information
Return to last
page opened
Go to
contents page