Honda 2015 Annual Report Download - page 17
Download and view the complete annual report
Please find page 17 of the 2015 Honda annual report below. You can navigate through the pages in the report by either clicking on the pages listed below, or by using the keyword search tool below to find specific information within the annual report.-
 1
1 -
2
-
3
-
4
-
5
-
6
-
 7
7 -
 8
8 -
 9
9 -
 10
10 -
 11
11 -
 12
12 -
 13
13 -
 14
14 -
 15
15 -
 16
16 -
 17
17 -
 18
18 -
 19
19 -
 20
20 -
 21
21 -
 22
22 -
 23
23 -
 24
24 -
 25
25 -
 26
26 -
 27
27 -
28
-
29
-
30
-
31
-
32
-
33
-
34
-
35
-
36
-
37
-
38
-
39
-
40
-
41
-
42
-
43
-
44
-
45
-
46
 |
 |

100
200
400
11 12 13 14 15
6.0
0 0.0
12.0
300 18.0
24.0
–6.0
(Fiscal years ended March 31)
Honda Group
Unit Sales /
Consolidated
Unit Sales
(Thousands)
338
2,705
1,091
467
1,382
Japan North
AmericaEurope Asia Other
Regions
2014 2015 % change
Japan ¥ 85,857 ¥ 82,176 (4.3)%
North America 97,344 107,615 10.6
Europe 64,114 67,536 5.3
Asia 40,345 40,632 0.7
Other Regions 24,404 24,589 0.8
Total ¥312,064 ¥322,548 3.4 %
Sales Revenue
by Region
Yen (millions)
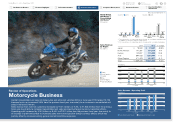
Review of Operations
Power Product and Other Businesses
Honda’s consolidated unit sales of power products totaled 5,983 thousand units in fiscal year 2015, a decrease of 0.6%
from the previous fiscal year, due mainly to a decrease in sales, primarily in Asia.
Sales revenue from external customers increased by ¥10.4 billion, or 3.4%, to ¥322.5 billion from the previous fiscal year,
due mainly to positive foreign currency translation effects, which was partially offset by a decreased consolidated unit
sales in the Power product business area.
Operating loss was ¥3.8 billion, a decrease of ¥6.9 billion from the previous fiscal year, due mainly to an increase in
operating costs and expenses in Other businesses and negative foreign currency effects.
Note: In power product business, there is no discrepancy between Honda Group Unit
Sales and Consolidated Unit Sales
Japan
North America
Europe
Asia
Other Regions
Operating Margin
U.S. GAAP IFRS
U.S. GAAP IFRS
2014 2015
Yen (billions) (%)
0
400
11 12 13 14 15
0
40
200 20
–20
Sales Revenue / Operating Profit (Loss)
Yen (billions)
Sales Revenue (left scale) Operating Profit (Loss) (right scale)
HSL2511
Honda Motor Co., Ltd. Annual Report 2015 16
4 Review of Operations
1 The Power of Dreams
2 Financial Highlights
3 To Our Shareholders
5 Corporate Governance
6 Financial Section
7
Investor Relations
Information
Return to last
page opened
Go to
contents page