Honda 2015 Annual Report Download - page 14
Download and view the complete annual report
Please find page 14 of the 2015 Honda annual report below. You can navigate through the pages in the report by either clicking on the pages listed below, or by using the keyword search tool below to find specific information within the annual report.-
 1
1 -
2
-
3
-
 4
4 -
 5
5 -
 6
6 -
 7
7 -
 8
8 -
 9
9 -
 10
10 -
 11
11 -
 12
12 -
 13
13 -
 14
14 -
 15
15 -
 16
16 -
 17
17 -
 18
18 -
 19
19 -
 20
20 -
 21
21 -
 22
22 -
 23
23 -
 24
24 -
25
-
26
-
27
-
28
-
29
-
30
-
31
-
32
-
33
-
34
-
35
-
36
-
37
-
38
-
39
-
40
-
41
-
42
-
43
-
44
-
45
-
46
 |
 |
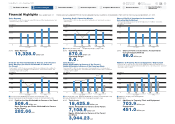
761
1,750
161 269
1,426
Japan North
AmericaEurope Asia Other
Regions
696
1,750
161 269
637
Japan North
AmericaEurope Asia Other
Regions
2,500
5,000
10,000
11 12 13 14 15
2.0
0 0.0
4.0
7,500 6.0
8.0
–2.0
(Fiscal years ended March 31)
Honda Group
Unit Sales*1 /
Consolidated
Unit Sales*2
(Thousands)
Note:
Certain sales of automobiles that
are financed with residual value
type auto loans by our Japanese
finance subsidiaries and sold
through our consolidated
subsidiaries are accounted for
as operating leases in conformity
with IFRS and are not included
in consolidated sales revenue to
external customers in the
Automobile business. Accord-
ingly, they are not included in
consolidated unit sales.
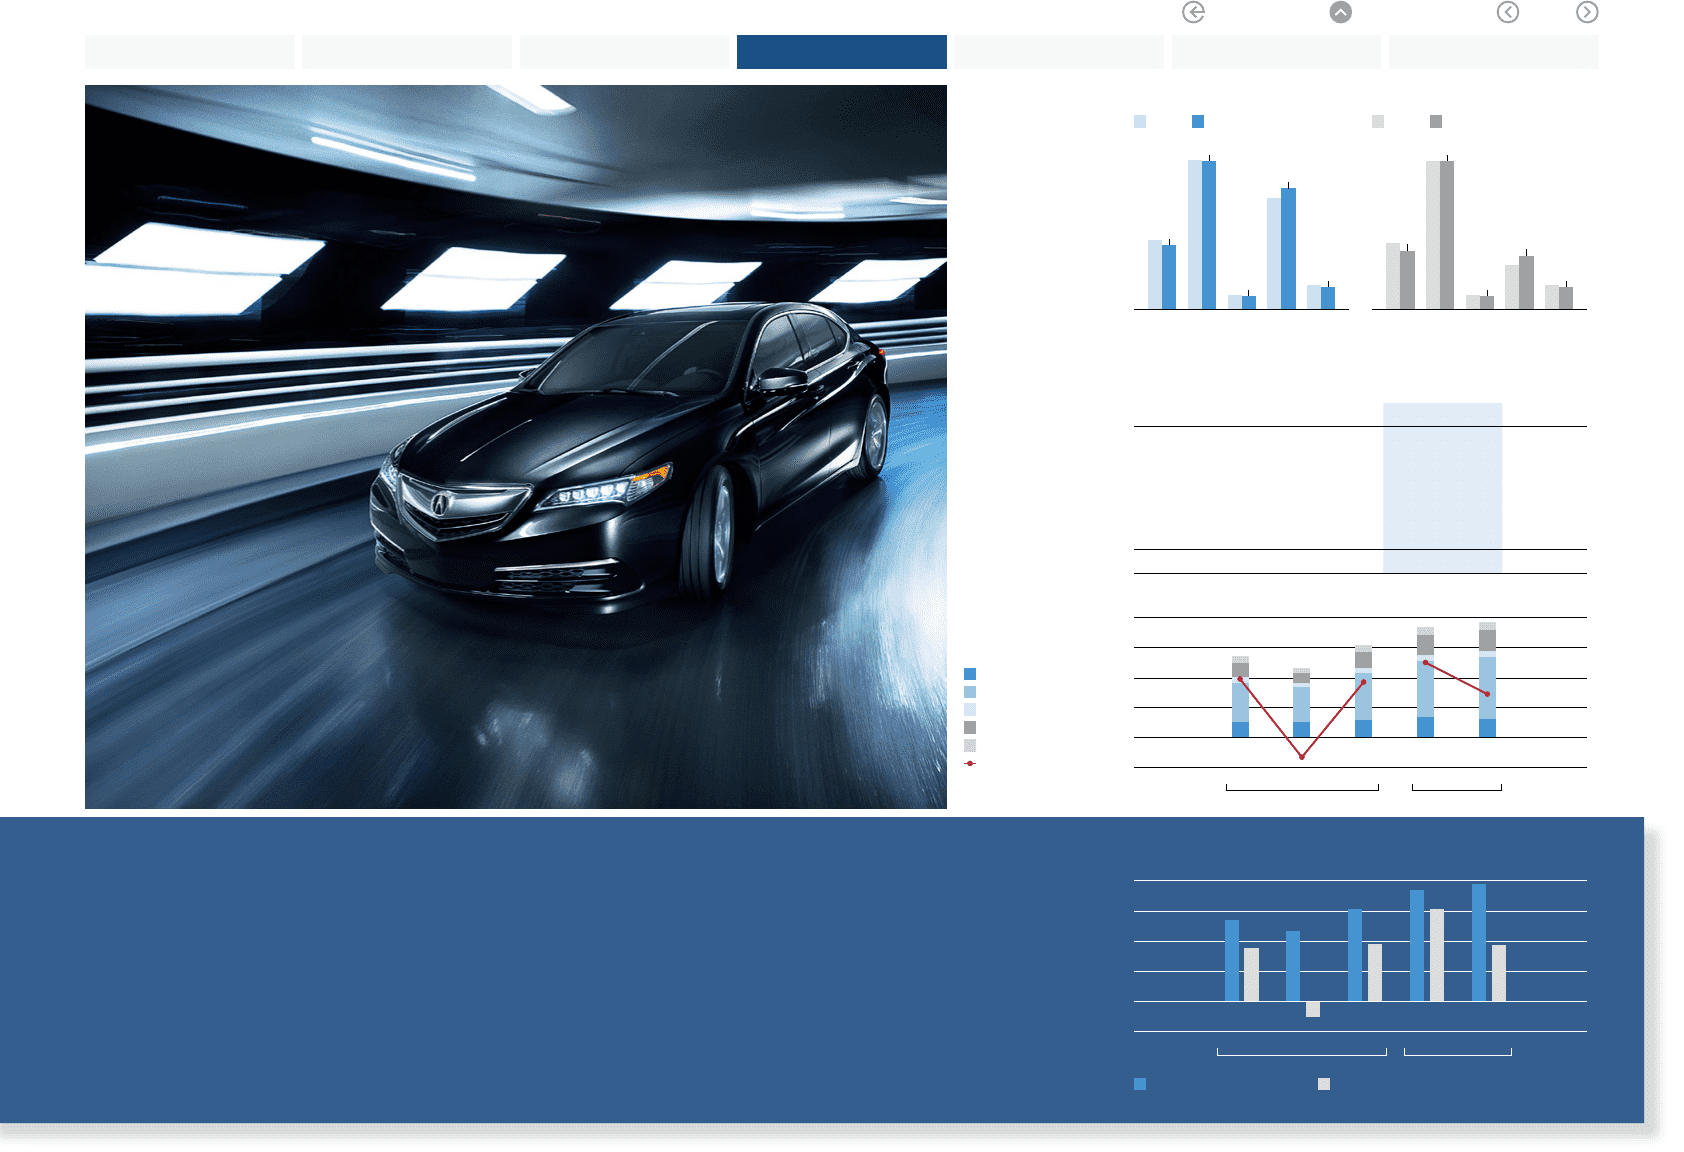
2014 2015 % change
Japan ¥1,677,530 ¥1,526,054 (9.0)%
North America 4,723,319 5,199,008 10.1
Europe 493,087 456,562 (7.4)
Asia 1,641,585 1,795,791 9.4
Other Regions 643,252 625,920 (2.7)
Total ¥9,178,773 ¥9,603,335 4.6 %
Sales Revenue
by Region
Yen (millions)
Review of Operations
Automobile Business
Honda’s consolidated unit sales of automobiles totaled 3,513 thousand units in fiscal year 2015, a decrease of 0.5% from
the previous fiscal year, due mainly to a unit sales decline in Japan and Thailand, where market conditions were unfavorable.
This was despite an increase in unit sales, primarily in Indonesia and India, due to the launch of new automobile models.
Sales revenue from external customers increased by ¥424.5 billion, or 4.6%, to ¥9,603.3 billion from the previous
fiscal year, due mainly to positive foreign currency translation effects.
Operating profit decreased by ¥181.4 billion, or 39.3%, to ¥279.7 billion from the previous fiscal year, due mainly to
increased selling, general and administrative expenses including product warranty expenses, which was partially offset
by continuing cost reduction efforts and positive foreign currency effects.
*1 The total unit sales of completed products of Honda, its consolidated subsidiaries and
its affiliates accounted for under the equity method
*2 The total unit sales of completed products of Honda and its consolidated subsidiaries
Japan
North America
Europe
Asia
Other Regions
Operating Margin
U.S. GAAP IFRS
U.S. GAAP IFRS
Yen (billions) (%)
0
7,500
10,000
11 12 13 14 15
0
450
5,000 300
2,500 150
600
–150
Sales Revenue / Operating Profit (Loss)
Yen (billions)
Sales Revenue (left scale) Operating Profit (Loss) (right scale)
2014 2015 2014 2015
Acura TLX
(North America)
Honda Motor Co., Ltd. Annual Report 2015 13
4 Review of Operations
1 The Power of Dreams
2 Financial Highlights
3 To Our Shareholders
5 Corporate Governance
6 Financial Section
7
Investor Relations
Information
Return to last
page opened
Go to
contents page