Harris Teeter 2012 Annual Report Download - page 2
Download and view the complete annual report
Please find page 2 of the 2012 Harris Teeter annual report below. You can navigate through the pages in the report by either clicking on the pages listed below, or by using the keyword search tool below to find specific information within the annual report.-
 1
1 -
 2
2 -
 3
3 -
 4
4 -
 5
5 -
 6
6 -
 7
7 -
 8
8 -
 9
9 -
 10
10 -
 11
11 -
 12
12 -
 13
13 -
14
-
15
-
16
-
17
-
18
-
19
-
20
-
21
-
22
-
23
-
24
-
25
-
26
-
27
-
28
-
29
-
30
-
31
-
32
-
33
-
34
-
35
-
36
-
37
-
38
-
39
-
40
-
41
-
42
-
43
-
44
-
45
-
46
-
47
-
48
-
49
-
50
-
51
-
52
-
53
-
54
-
55
-
56
-
57
-
58
-
59
-
60
-
61
-
62
-
63
-
64
-
65
-
66
-
67
-
68
-
69
-
70
-
71
-
72
-
73
-
74
-
75
-
76
-
77
-
78
-
79
-
80
-
81
-
82
-
83
-
84
-
85
-
86
-
87
-
88
-
89
-
90
-
91
-
92
-
93
-
94
-
95
-
96
-
97
-
98
-
99
-
100
-
101
-
102
-
103
-
104
-
105
-
106
-
107
-
108
-
109
-
110
-
111
-
112
-
113
-
114
-
115
-
116
-
117
-
118
-
119
-
120
-
121
-
122
-
123
-
124
-
125
-
126
-
127
-
128
 |
 |

2010 (2)
$ 4,099,353
2,871,907
1,227,446
1,045,860
4,730
1,050,590
$ 176,856
$ 98,652
13,389
$ 112,041
$ 2.03
0.28
2.31
$ 0.48
$ 892,449
13.8%
$ 18.25
$ 128,183
121,731
144,385
1,893,671
$ 306,096
25.4%
25,200
48,901,482
2011
$ 4,285,565
3,015,517
1,270,048
1,078,978
10,364
1,089,342
$ 180,706
$ 111,458
(20,211)
$ 91,247
$ 2.28
(0.41)
1.87
$ 0.52
$ 969,275
10.2%
$ 19.72
$ 147,993
128,717
280,300
1,984,424
$ 287,330
22.8%
24,500
49,147,817
(dollars in thousands, except share and per share data)
Net Sales
Cost of Sales
Gross Prot
Selling, General and Administrative (SG&A) Expenses
Harris Teeter
Corporate
Operating Prot
Earnings From Continuing Operations
(Loss) Earnings From Discontinued Operations
Net Earnings
Earnings (Loss) Per Share - Diluted:
Continuing Operations
Discontinued Operations
Net Earnings
Dividends Per Share
Shareholders’ Equity - Harris Teeter Supermarkets, Inc.
Percent Return on Beginning Equity
Book Value Per Share
Capital Expenditures (3)
Depreciation and Amortization (3)
Working Capital
Total Assets
Long-Term Debt - Including Current Portion
Long-Term Debt as a Percent of Capital Employed
Number of Employees
Common Shares Outstanding
2012 (1)
$ 4,535,414
3,176,914
1,358,500
1,180,311
7,211
1,187,522
$ 170,978
$ 99,927
(17,415)
$ 82,512
$ 2.04
(0.36)
1.68
$ 0.55
$ 1,037,619
8.5%
$ 21.05
$ 199,946
135,542
182,755
1,952,488
$ 212,490
17.0%
25,300
49,292,585
2008
$ 3,664,804
2,525,947
1,138,857
961,092
7,864
968,956
$169,901
$ 93,577
3,175
$ 96,752
$ 1.94
0.07
2.00
$ 0.48
$ 823,159
13.1%
$ 17.05
$ 192,231
96,516
66,353
1,696,407
$ 320,578
27.9%
25,500
48,278,136
2007
$ 3,299,377
2,277,638
1,021,739
867,656
9,268
876,924
$ 144,815
$ 80,006
682
$ 80,688
$ 1.66
0.01
1.68
$ 0.44
$ 736,250
12.0%
$ 15.30
$ 212,237
81,702
73,494
1,529,689
$ 264,392
26.3%
24,800
48,127,252
2006
$ 2,922,679
2,025,042
897,637
770,000
8,379
778,379
$ 119,258
$ 70,334
2,002
$ 72,336
$ 1.47
0.04
1.52
$ 0.44
$ 670,517
11.9%
$ 14.10
$ 210,910
70,778
98,119
1,362,936
$ 237,731
26.0%
22,400
47,557,894
2009
$ 3,827,005
2,657,564
1,169,441
993,850
7,477
1,001,327
$ 168,114
$ 93,597
(7,633)
$ 85,964
$ 1.94
(0.16)
1.78
$ 0.48
$ 811,590
10.4%
$ 16.72
$ 206,703
109,907
71,421
1,844,321
$ 365,087
30.8%
24,800
48,545,080
2005
$ 2,644,976
1,857,129
787,847
674,267
9,398
683,665
$ 104,182
$ 61,731
6,867
$ 68,598
$ 1.29
0.14
1.44
$ 0.44
$ 608,942
12.5%
$ 12.82
$ 115,448
60,966
130,811
1,203,640
$ 163,445
21.0%
20,400
47,488,979
2004 (2)
$ 2,572,367
1,816,446
755,921
651,515
6,767
658,282
$ 97,639
$ 56,686
7,973
$ 64,659
$ 1.21
0.17
1.38
$ 0.40
$ 549,710
13.1%
$ 11.76
$ 83,988
59,950
187,971
1,109,097
$ 166,287
23.0%
18,200
46,730,758
2003
$ 2,431,632
1,728,454
703,178
609,556
6,984
616,540
$ 86,638
$ 50,699
9,183
$ 59,882
$ 1.09
0.20
1.29
$ 0.36
$ 495,265
13.1%
$ 10.71
$ 64,384
59,344
165,192
1,065,022
$ 189,095
27.3%
17,500
46,223,233
2002 (1)
$ 2,349,650
1,671,982
677,668
588,895
9,446
598,341
79,327
$ 43,839
8,144
$ 51,983
$ 0.94
0.17
1.12
$ 0.36
$ 457,688
11.7%
$ 9.85
$
71,283
56,391
165,911
1,039,271
$
185,892
28.5%
17,650
46,454,188
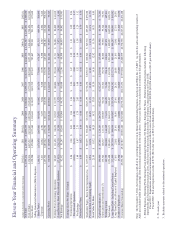
Eleven-Year Financial and Operating Summary
Note: On November 7, 2011, the Company sold all of its ownership interest in its thread manufacturing business, American and Erd, Inc. (“A&E”). As such, the sales and operating results of
A&E are included within (loss) earnings from discontinued operations in the table above. Prior years have been reclassied to conform to this presentation.
1. SG&A Expenses, Operating Prot, Earnings From Continuing Operations, Net Earnings, Earnings Per Share - Diluted and related returns include the following
impairments and incremental transaction costs, which have been previously disclosed in the Company’s annual reports on Form 10-K:
Fiscal 2012: Impairments and other incremental costs associated with the Lowes Foods transaction of $29,809 ($18,094 after tax or $0.37 per diluted share)
Fiscal 2002: Exit and impairment credits of $710 ($431 after taxes, or $0.01 per diluted share).
2. 53-week year
3. Excludes amounts related to discontinued operations.