Harris Teeter 2012 Annual Report Download - page 14
Download and view the complete annual report
Please find page 14 of the 2012 Harris Teeter annual report below. You can navigate through the pages in the report by either clicking on the pages listed below, or by using the keyword search tool below to find specific information within the annual report.-
 1
1 -
2
-
3
-
 4
4 -
 5
5 -
 6
6 -
 7
7 -
 8
8 -
 9
9 -
 10
10 -
 11
11 -
 12
12 -
 13
13 -
 14
14 -
 15
15 -
 16
16 -
 17
17 -
 18
18 -
 19
19 -
 20
20 -
 21
21 -
 22
22 -
 23
23 -
 24
24 -
25
-
26
-
27
-
28
-
29
-
30
-
31
-
32
-
33
-
34
-
35
-
36
-
37
-
38
-
39
-
40
-
41
-
42
-
43
-
44
-
45
-
46
-
47
-
48
-
49
-
50
-
51
-
52
-
53
-
54
-
55
-
56
-
57
-
58
-
59
-
60
-
61
-
62
-
63
-
64
-
65
-
66
-
67
-
68
-
69
-
70
-
71
-
72
-
73
-
74
-
75
-
76
-
77
-
78
-
79
-
80
-
81
-
82
-
83
-
84
-
85
-
86
-
87
-
88
-
89
-
90
-
91
-
92
-
93
-
94
-
95
-
96
-
97
-
98
-
99
-
100
-
101
-
102
-
103
-
104
-
105
-
106
-
107
-
108
-
109
-
110
-
111
-
112
-
113
-
114
-
115
-
116
-
117
-
118
-
119
-
120
-
121
-
122
-
123
-
124
-
125
-
126
-
127
-
128
 |
 |

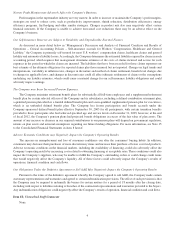
Company acquired 350,000 square feet of additional distribution capacity that is contiguous to its existing distribution facility
in Greensboro, North Carolina. This represented an approximate 22% increase in the square footage of the Company’s existing
distribution facilities and was acquired to meet our continued growth. There were 208 stores in operations at the end of fiscal
2012, as compared to 204 at the end of fiscal 2011 and 199 at the end of fiscal 2010.
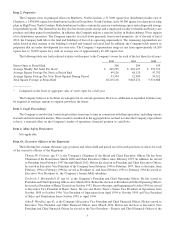
Results of Operations
The following table sets forth the components of consolidated net earnings for the Company for the 52 weeks ended
October 2, 2012 (fiscal 2012) and October 2, 2011 (fiscal 2011) and the 53 weeks ended October 3, 2010 (fiscal 2010),
respectively. The table also sets forth the percentage increase or decrease of such components over the prior year (in thousands):
Fiscal 2012 Fiscal 2011 Fiscal 2010 % Inc. (Dec.)
%to
Sales
%to
Sales
%to
Sales
2012 vs
2011
2011 vs
2010
Net Sales $4,535,414 100.00 $4,285,565 100.00 $4,099,353 100.00 5.8 4.5
Cost of Sales 3,176,914 70.05 3,015,517 70.36 2,871,907 70.06 5.4 5.0
Gross Profit 1,358,500 29.95 1,270,048 29.64 1,227,446 29.94 7.0 3.5
SG&A Expenses:
Harris Teeter without Lowes Foods
Incremental Transaction Costs 1,150,501 25.36 1,078,978 25.18 1,045,860 25.51 6.6 3.2
Lowes Foods Incremental
Transaction Costs 29,810 0.66 - 0.00 - 0.00 n.m. n.m.
Corporate 7,211 0.16 10,364 0.24 4,730 0.12 (30.4) 119.1
Total 1,187,522 26.18 1,089,342 25.42 1,050,590 25.63 9.0 3.7
Operating Profit 170,978 3.77 180,706 4.22 176,856 4.31 (5.4) 2.2
Interest Expense, net 16,411 0.36 18,983 0.44 19,521 0.47 (13.5) (2.8)
Net Investment Gains - 0.00 19,392 0.45 310 0.01 n.m. n.m.
Earnings From Continuing Operations
Before Income Taxes 154,567 3.41 181,115 4.23 157,645 3.85 (14.7) 14.9
Income Tax Expense 54,640 1.21 69,657 1.63 58,993 1.44 (21.6) 18.1
Earnings From Continuing Operations 99,927 2.20 111,458 2.60 98,652 2.41 (10.3) 13.0
(Loss) Earnings From Discontinued
Operations, Net of Income Taxes (17,415) (20,211) 13,389
Net Earnings $ 82,512 $ 91,247 $ 112,041
_______________
n.m. – not meaningful
Sales
Net sales increased 5.8% in fiscal 2012 and 4.5% in fiscal 2011 when compared to the respective prior years. The increase
in sales in fiscal 2012 and fiscal 2011 was attributable to increases in comparable store sales (see definition below) and sales
from new stores that were partially offset by store closings. The fiscal 2011 sales increase over fiscal 2010 was impacted by
the fact that fiscal 2010 was a 53-week year. On a comparable week basis (reducing fiscal 2010 sales for the first week of the
annual period), sales increased by 6.4% from fiscal 2010 to fiscal 2011. Comparable store sales for fiscal 2012 increased 3.97%
($165.5 million), as compared to an increase of 3.27% ($129.4 million) in fiscal 2011 and a decrease of 1.10% ($42.0 million)
in fiscal 2010 (adjusted to 52 weeks). Comparable store sales have been negatively impacted, to some extent, by the
cannibalization created by strategically opening stores in key major markets that have a close proximity to existing stores.
Management believes that the Company’s strategy of opening additional stores within close proximity to existing stores, and
any similar new additions in the foreseeable future, have a strategic benefit of enabling the Company to capture sales and expand
market share as the markets it serves continue to grow. During fiscal 2012, the Company increased the number of stores in
operation by five, as compared to a net increase of five stores during fiscal 2011 and a net increase of 10 stores during fiscal
2010. The increase in sales from new stores exceeded the loss of sales from closed stores by $82.4 million in fiscal 2012, $122.0
million in fiscal 2011 and $238.2 million in fiscal 2010.
10