Harris Teeter 2012 Annual Report Download - page 11
Download and view the complete annual report
Please find page 11 of the 2012 Harris Teeter annual report below. You can navigate through the pages in the report by either clicking on the pages listed below, or by using the keyword search tool below to find specific information within the annual report.-
 1
1 -
 2
2 -
 3
3 -
 4
4 -
 5
5 -
 6
6 -
 7
7 -
 8
8 -
 9
9 -
 10
10 -
 11
11 -
 12
12 -
 13
13 -
 14
14 -
 15
15 -
 16
16 -
 17
17 -
 18
18 -
 19
19 -
 20
20 -
 21
21 -
 22
22 -
23
-
24
-
25
-
26
-
27
-
28
-
29
-
30
-
31
-
32
-
33
-
34
-
35
-
36
-
37
-
38
-
39
-
40
-
41
-
42
-
43
-
44
-
45
-
46
-
47
-
48
-
49
-
50
-
51
-
52
-
53
-
54
-
55
-
56
-
57
-
58
-
59
-
60
-
61
-
62
-
63
-
64
-
65
-
66
-
67
-
68
-
69
-
70
-
71
-
72
-
73
-
74
-
75
-
76
-
77
-
78
-
79
-
80
-
81
-
82
-
83
-
84
-
85
-
86
-
87
-
88
-
89
-
90
-
91
-
92
-
93
-
94
-
95
-
96
-
97
-
98
-
99
-
100
-
101
-
102
-
103
-
104
-
105
-
106
-
107
-
108
-
109
-
110
-
111
-
112
-
113
-
114
-
115
-
116
-
117
-
118
-
119
-
120
-
121
-
122
-
123
-
124
-
125
-
126
-
127
-
128
 |
 |

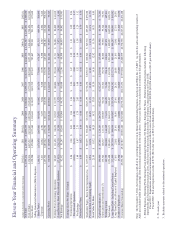
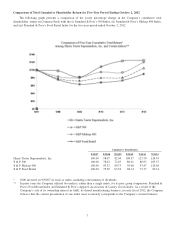
Comparison of Total Cumulative Shareholder Return for Five-Year Period Ending October 2, 2012
The following graph presents a comparison of the yearly percentage change in the Company’s cumulative total
shareholders’ return on Common Stock with the (i) Standard & Poor’s 500 Index, (ii) Standard & Poor’s Midcap 400 Index,
and (iii) Standard & Poor’s Food Retail Index for the five-year period ended October 2, 2012.
Cumulative Total Return
9/30/07 9/30/08 9/30/09 9/30/10 9/30/11 9/30/12
Harris Teeter Supermarkets, Inc. 100.00 98.07 82.04 108.57 123.70 124.93
S & P 500 100.00 78.02 72.63 80.01 80.93 105.37
S & P Midcap 400 100.00 83.32 80.73 95.08 93.87 120.65
S & P Food Retail 100.00 75.29 63.54 68.14 73.37 90.14
* $100 invested on 9/30/07 in stock or index, including reinvestment of dividends.
** In prior years the Company utilized two indices, rather than a single index, for its peer group comparison: Standard &
Poor’s Food Retail Index and Standard & Poor’s Apparel, Accessories & Luxury Goods Index. As a result of the
Company’s sale of its ownership interest in A&E, its thread manufacturing business, in early fiscal 2012, the Company
believes that the current presentation of one index more accurately corresponds to the Company’s current business.
7